emooki
HomePrice mapTransactions
🇬🇧 English🇫🇷 Français🇩🇪 Deutsch🇪🇸 Español🇮🇹 Italiano

Real estate price map


Real estate price map in the municipality of Changé.

Mayenne (53)
Changé

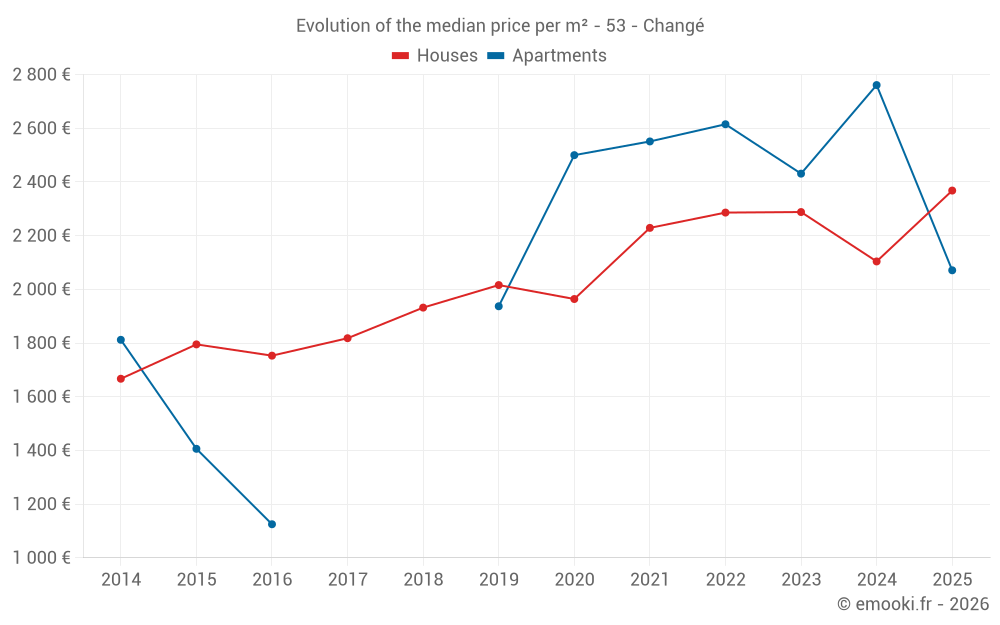
Median price of real estate
in the municipality of Changé

HousesHouses
2 368  /m²
1-23-45-67-89-10
Reliability 9/10
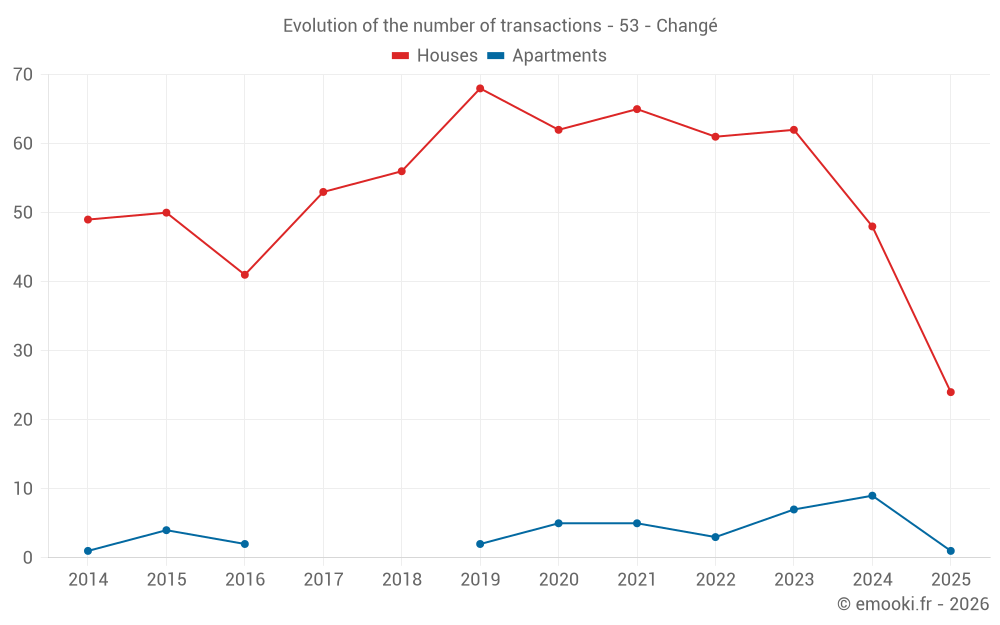
Median price on the 24 transactions of the last 6 months.
from 2 039 to
2 866  /m²
60% of transactions from the 2nd to the 8th deciles.
ApartmentsApartments
2 497  /m²
1-23-45-67-89-10
Reliability 6/10
Median price on the 18 transactions of the last 36 months.
from 2 093 to
2 783  /m²
60% of transactions from the 2nd to the 8th deciles.
DwellingsDwellings
2 352  /m²
1-23-45-67-89-10
Reliability 9/10
Median price on the 25 transactions of the last 6 months.
from 2 054 to
2 866  /m²
60% of transactions from the 2nd to the 8th deciles.
HousesEvolution of the price per m² of houses since...
1 year
+13%
2 years
+3.5%
3 years
+3.6%
4 years
+6.2%
5 years
+21%
6 years
+17%
7 years
+23%
8 years
+30%
9 years
+35%
10 years
+32%
11 years
+42%
ApartmentsEvolution of the price per m² of apartments since...
1 year
--
2 years
--
3 years
--
4 years
--
5 years
--
6 years
--
7 years
--
8 years
--
9 years
--
10 years
--
11 years
--

Yearly evolution

Evolution of the median price per m²

Evolution of the number of transactions

Warning, last year incomplete. Projections made based on the proportions between semesters of the previous year at the departmental/national level and by type of property.

Yearly data

Descending order
Year
Houses
house
transactions
Houses
house
Price per m²
Apartments
apt.
transactions
Apartments
apt.
Price per m²
2025
24
2 368 
1
2 071 
2024
48
2 104 
9
2 761 
2023
62
2 288 
7
2 431 
2022
61
2 286 
3
2 615 
2021
65
2 229 
5
2 551 
2020
62
1 964 
5
2 500 
2019
68
2 016 
2
1 937 
2018
56
1 932 
0
--- 
2017
53
1 818 
0
--- 
2016
41
1 753 
2
1 125 
2015
50
1 795 
4
1 406 
2014
49
1 667 
1
1 812 

Analysis

Structure of prices per m²

Values of price percentiles per m² over the periods used for the estimated price of each type of property.

Structure of transaction amounts

Values of transaction amounts percentiles over the periods used for the estimated price of each type of property.

Transaction amounts and prices per m² by percentile

Ascending order
Percentile
Houses
house
Price per m²
Houses
house
Transaction amount
Apartments
apt.
Price per m²
Apartments
apt.
Transaction amount
10th percentile
1 935 
169 K
1 464 
121 K
20th percentile
2 039 
186 K
2 093 
128 K
30th percentile
2 108 
211 K
2 408 
146 K
40th percentile
2 207 
232 K
2 430 
160 K
50th percentile
2 368 
255 K
2 497 
166 K
60th percentile
2 549 
273 K
2 631 
172 K
70th percentile
2 770 
313 K
2 754 
182 K
80th percentile
2 866 
366 K
2 783 
205 K
90th percentile
3 185 
494 K
3 026 
233 K

National and departmental comparison

Evolution of the median price per m² of houses

Evolution of the median price per m² of apartments

Quarterly evolution

Evolution of the median price per m²

Evolution of the number of transactions

Quarterly data

Descending order
Quarter
Houses
house
transactions
Houses
house
Price per m²
Apartments
apt.
transactions
Apartments
apt.
Price per m²
2025 Q2
7
2 785 
0
--- 
2025 Q1
17
2 274 
1
2 071 
2024 Q4
12
1 844 
2
2 892 
2024 Q3
21
2 313 
2
2 806 
2024 Q2
7
2 018 
4
2 630 
2024 Q1
8
1 990 
1
2 125 
2023 Q4
17
2 304 
1
2 431 
2023 Q3
23
2 301 
1
3 088 
2023 Q2
11
2 222 
4
2 450 
2023 Q1
11
2 283 
1
1 429 
2022 Q4
14
2 176 
0
--- 
2022 Q3
18
2 307 
1
2 615 
2022 Q2
13
2 294 
1
2 836 
2022 Q1
16
2 272 
1
1 846 
2021 Q4
22
2 254 
1
2 609 
2021 Q3
20
2 183 
0
--- 
2021 Q2
12
2 142 
3
2 551 
2021 Q1
11
2 295 
1
2 093 
2020 Q4
19
1 985 
2
1 921 
2020 Q3
22
2 003 
1
2 500 
2020 Q2
9
1 793 
1
1 875 
2020 Q1
12
1 854 
1
2 670 
2019 Q4
20
2 009 
0
--- 
2019 Q3
21
2 121 
2
1 937 
2019 Q2
10
1 885 
0
--- 
2019 Q1
17
2 125 
0
--- 
2018 Q4
11
2 074 
0
--- 
2018 Q3
20
1 860 
0
--- 
2018 Q2
8
1 951 
0
--- 
2018 Q1
17
1 869 
0
--- 
2017 Q4
17
1 686 
0
--- 
2017 Q3
11
2 157 
0
--- 
2017 Q2
12
1 866 
0
--- 
2017 Q1
13
1 712 
0
--- 
2016 Q4
11
1 752 
0
--- 
2016 Q3
14
1 765 
1
300 
2016 Q2
8
1 736 
0
--- 
2016 Q1
8
2 245 
1
1 950 
2015 Q4
13
1 814 
2
2 038 
2015 Q3
18
1 666 
1
615 
2015 Q2
12
1 795 
0
--- 
2015 Q1
7
2 085 
1
1 036 
2014 Q4
16
1 690 
0
--- 
2014 Q3
13
1 856 
0
--- 
2014 Q2
12
1 652 
1
1 812 
2014 Q1
8
1 614 
0
--- 

Mayenne (53)

Most expensive cities

City
name
Descending orderHouses
house
Price per m²
2 368 
2 117 
2 030 
2 029 
1 989 
1 983 
1 920 
1 910 
City
name
Descending orderApartments
apt.
Price per m²
2 497 
2 138 
2 093 
1 992 
1 951 
1 597 
1 481 

Least expensive cities

City
name
Ascending orderHouses
house
Price per m²
594 
686 
694 
719 
City
name
Ascending orderApartments
apt.
Price per m²
151 
151 
156 
170 
202