emooki
HomePrice mapTransactions
🇬🇧 English🇫🇷 Français🇩🇪 Deutsch🇪🇸 Español🇮🇹 Italiano

Real estate price map


Real estate price map in the municipality of Parné-sur-Roc.

Mayenne (53)
Parné-sur-Roc

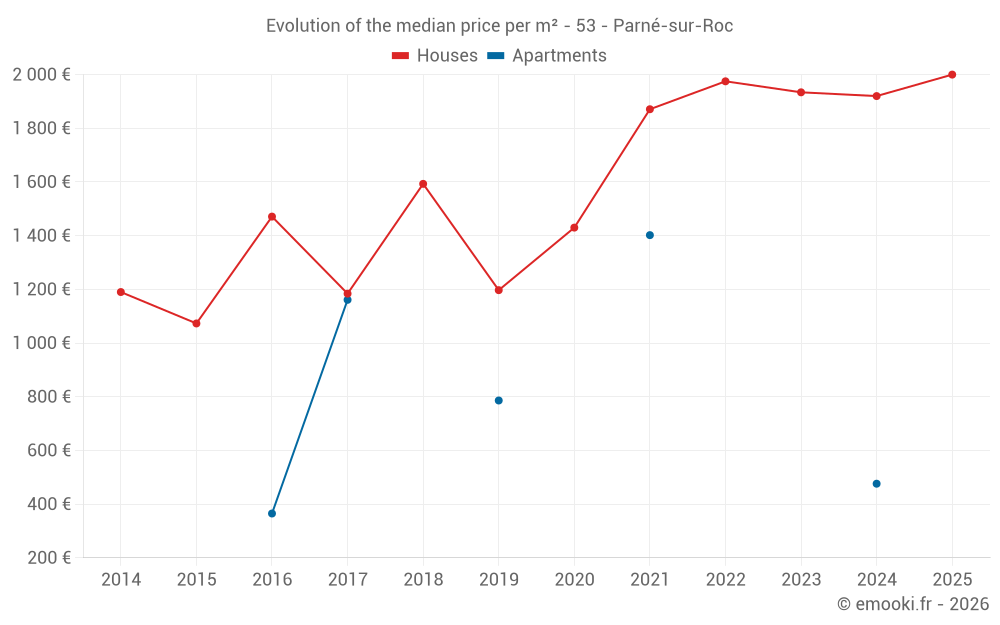
Median price of real estate
in the municipality of Parné-sur-Roc

HousesHouses
1 920  /m²
1-23-45-67-89-10
Reliability 7/10
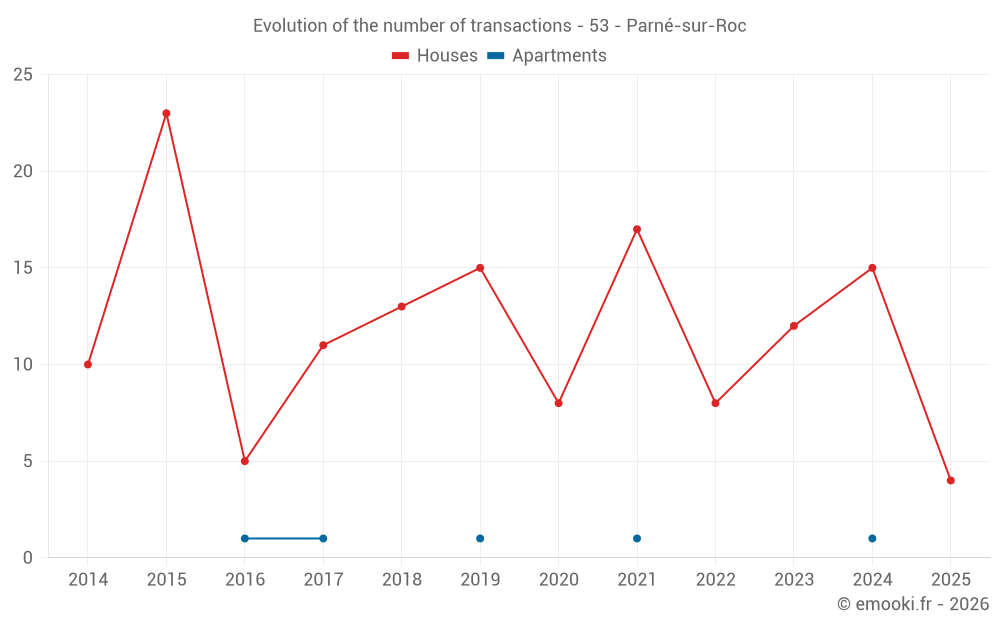
Median price on the 27 transactions of the last 24 months.
from 1 490 to
2 180  /m²
60% of transactions from the 2nd to the 8th deciles.
ApartmentsApartments
974  /m²
1-23-45-67-89-10
Reliability 2/10
Median price on the 4 transactions of the last 96 months.
DwellingsDwellings
1 862  /m²
1-23-45-67-89-10
Reliability 7/10
Median price on the 28 transactions of the last 24 months.
from 1 145 to
2 175  /m²
60% of transactions from the 2nd to the 8th deciles.
HousesEvolution of the price per m² of houses since...
1 year
--
2 years
--
3 years
--
4 years
--
5 years
--
6 years
--
7 years
--
8 years
--
9 years
--
10 years
--
11 years
--
ApartmentsEvolution of the price per m² of apartments since...
1 year
--
2 years
--
3 years
--
4 years
--
5 years
--
6 years
--
7 years
--
8 years
--
9 years
--
10 years
--
11 years
--

Yearly evolution

Evolution of the median price per m²

Evolution of the number of transactions

Warning, last year incomplete. Projections made based on the proportions between semesters of the previous year at the departmental/national level and by type of property.

Yearly data

Descending order
Year
Houses
house
transactions
Houses
house
Price per m²
Apartments
apt.
transactions
Apartments
apt.
Price per m²
2025
4
2 000 
0
--- 
2024
15
1 920 
1
476 
2023
12
1 934 
0
--- 
2022
8
1 975 
0
--- 
2021
17
1 871 
1
1 402 
2020
8
1 430 
0
--- 
2019
15
1 197 
1
786 
2018
13
1 593 
0
--- 
2017
11
1 184 
1
1 161 
2016
5
1 471 
1
365 
2015
23
1 073 
0
--- 
2014
10
1 190 
0
--- 

Analysis

Structure of prices per m²

Values of price percentiles per m² over the periods used for the estimated price of each type of property.

Structure of transaction amounts

Values of transaction amounts percentiles over the periods used for the estimated price of each type of property.

Transaction amounts and prices per m² by percentile

Ascending order
Percentile
Houses
house
Price per m²
Houses
house
Transaction amount
Apartments
apt.
Price per m²
Apartments
apt.
Transaction amount
10th percentile
910 
80 400 
569 
83 970 
20th percentile
1 490 
113 K
662 
108 K
30th percentile
1 619 
149 K
755 
132 K
40th percentile
1 724 
163 K
861 
142 K
50th percentile
1 920 
180 K
974 
145 K
60th percentile
1 972 
201 K
1 086 
148 K
70th percentile
2 071 
220 K
1 185 
153 K
80th percentile
2 180 
240 K
1 257 
162 K
90th percentile
2 349 
258 K
1 330 
171 K

National and departmental comparison

Evolution of the median price per m² of houses

Evolution of the median price per m² of apartments

Quarterly evolution

Evolution of the median price per m²

Evolution of the number of transactions

Quarterly data

Descending order
Quarter
Houses
house
transactions
Houses
house
Price per m²
Apartments
apt.
transactions
Apartments
apt.
Price per m²
2025 Q2
2
1 104 
0
--- 
2025 Q1
2
2 000 
0
--- 
2024 Q4
3
2 077 
0
--- 
2024 Q3
5
1 804 
0
--- 
2024 Q2
2
1 560 
1
476 
2024 Q1
5
1 752 
0
--- 
2023 Q4
3
1 653 
0
--- 
2023 Q3
5
1 705 
0
--- 
2023 Q2
1
1 477 
0
--- 
2023 Q1
3
2 250 
0
--- 
2022 Q4
3
2 021 
0
--- 
2022 Q3
3
2 094 
0
--- 
2022 Q2
1
1 929 
0
--- 
2022 Q1
1
952 
0
--- 
2021 Q4
7
1 882 
0
--- 
2021 Q3
3
1 871 
0
--- 
2021 Q2
3
1 931 
1
1 402 
2021 Q1
4
1 604 
0
--- 
2020 Q4
1
1 059 
0
--- 
2020 Q3
4
1 106 
0
--- 
2020 Q2
3
2 289 
0
--- 
2019 Q4
3
993 
1
786 
2019 Q3
7
1 338 
0
--- 
2019 Q2
1
1 361 
0
--- 
2019 Q1
4
1 266 
0
--- 
2018 Q4
7
1 631 
0
--- 
2018 Q3
1
2 105 
0
--- 
2018 Q2
2
1 312 
0
--- 
2018 Q1
3
1 593 
0
--- 
2017 Q4
2
1 389 
1
1 161 
2017 Q3
2
1 450 
0
--- 
2017 Q2
4
1 000 
0
--- 
2017 Q1
3
737 
0
--- 
2016 Q4
1
1 471 
0
--- 
2016 Q3
1
1 339 
1
365 
2016 Q2
1
917 
0
--- 
2016 Q1
2
1 593 
0
--- 
2015 Q4
4
1 684 
0
--- 
2015 Q3
7
1 193 
0
--- 
2015 Q2
6
1 056 
0
--- 
2015 Q1
6
1 054 
0
--- 
2014 Q4
3
695 
0
--- 
2014 Q3
2
1 350 
0
--- 
2014 Q2
2
1 276 
0
--- 
2014 Q1
3
1 245 
0
--- 

Mayenne (53)

Most expensive cities

City
name
Descending orderHouses
house
Price per m²
2 368 
2 117 
2 030 
2 029 
1 989 
1 983 
1 920 
1 910 
City
name
Descending orderApartments
apt.
Price per m²
2 497 
2 138 
2 093 
1 992 
1 951 
1 597 
1 481 

Least expensive cities

City
name
Ascending orderHouses
house
Price per m²
594 
686 
694 
719 
City
name
Ascending orderApartments
apt.
Price per m²
151 
151 
156 
170 
202