emooki
HomePrice mapTransactions
🇬🇧 English🇫🇷 Français🇩🇪 Deutsch🇪🇸 Español🇮🇹 Italiano

Real estate price map


Real estate price map in the municipality of Le Genest-Saint-Isle, choose a section to see transactions by parcel.

Mayenne (53)

Le Genest-Saint-Isle - Real estate price m²

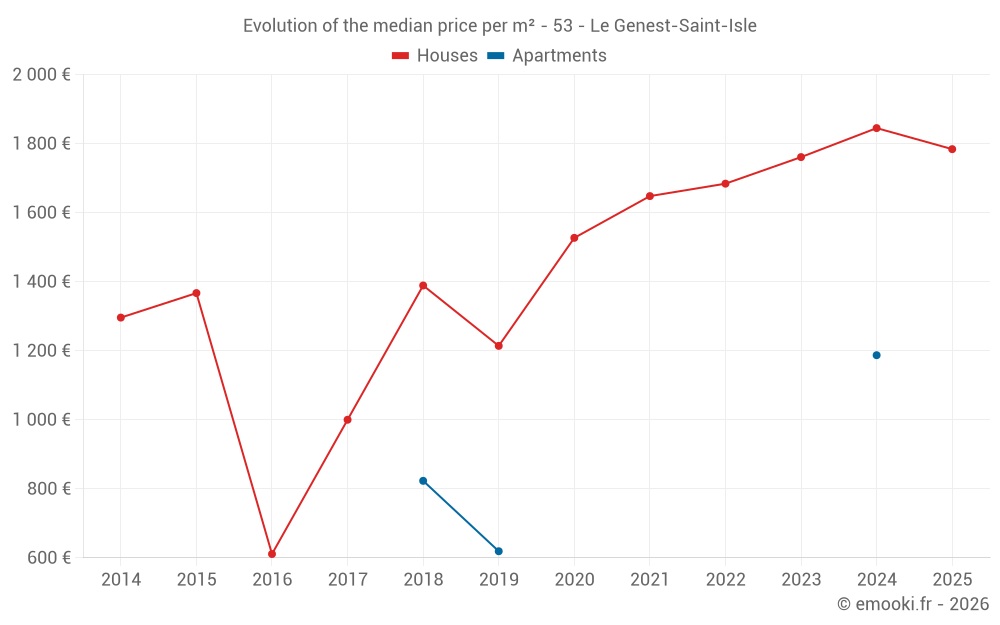
Median price of real estate
in the municipality of Le Genest-Saint-Isle

HousesHouses
1 848  /m²
1-23-45-67-89-10
Reliability 8/10
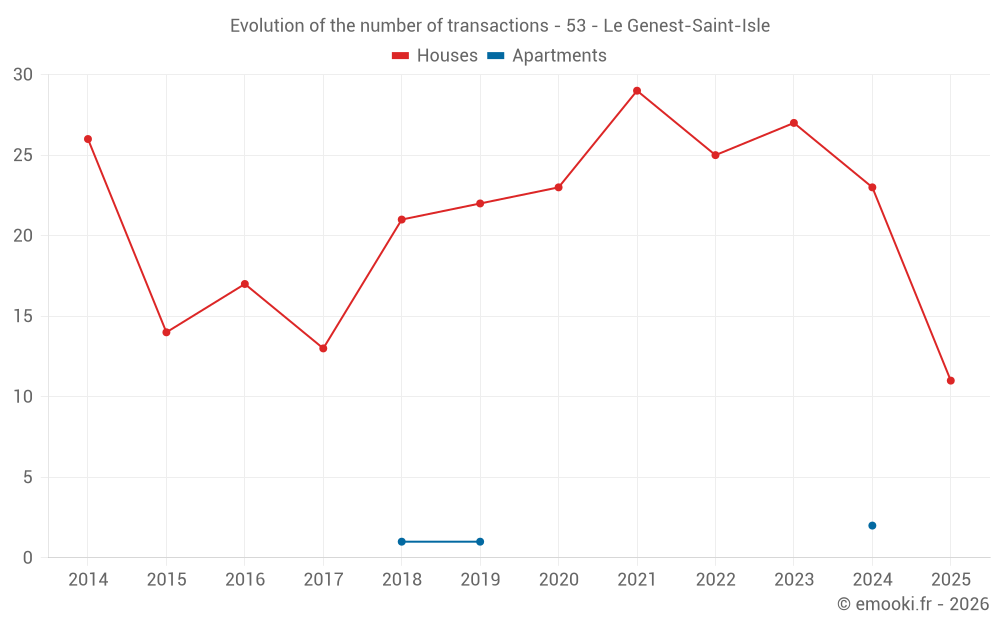
Median price on the 22 transactions of the last 12 months.
from 1 453 to
2 253  /m²
60% of transactions from the 2nd to the 8th deciles.
ApartmentsApartments
965  /m²
1-23-45-67-89-10
Reliability 2/10
Median price on the 4 transactions of the last 96 months.
DwellingsDwellings
1 845  /m²
1-23-45-67-89-10
Reliability 8/10
Median price on the 23 transactions of the last 12 months.
from 1 406 to
2 233  /m²
60% of transactions from the 2nd to the 8th deciles.
HousesEvolution of the price per m² of houses since...
1 year
-3.3%
2 years
+1.3%
3 years
+5.9%
4 years
+8.3%
5 years
+17%
6 years
+47%
7 years
+28%
8 years
+78%
9 years
+192%
10 years
+31%
11 years
+38%
The price per m² of houses has decreased by 3.3% since 1 year, but it has increased by 192% in 9 years.

Yearly evolution

Evolution of the median price per m²

Evolution of the median price per m² - 53 - Le Genest-Saint-Isle

Evolution of the number of transactions

Warning, last year incomplete. Projections made based on the proportions between semesters of the previous year at the departmental/national level and by type of property.

Evolution of the number of transactions - 53 - Le Genest-Saint-Isle

Yearly data

Descending order
Year
Houses
house
transactions
Houses
house
Price per m²
Apartments
apt.
transactions
Apartments
apt.
Price per m²
2025
11
1 784 
0
--- 
2024
23
1 845 
2
1 187 
2023
27
1 761 
0
--- 
2022
25
1 684 
0
--- 
2021
29
1 648 
0
--- 
2020
23
1 527 
0
--- 
2019
22
1 214 
1
619 
2018
21
1 389 
1
823 
2017
13
1 000 
0
--- 
2016
17
611 
0
--- 
2015
14
1 367 
0
--- 
2014
26
1 296 
0
--- 

Analysis

Structure of prices per m²

Values of price percentiles per m² over the periods used for the estimated price of each type of property.

Structure of transaction amounts

Values of transaction amounts percentiles over the periods used for the estimated price of each type of property.

Transaction amounts and prices per m² by percentile

Ascending order
Percentile
Houses
house
Price per m²
Houses
house
Transaction amount
Apartments
apt.
Price per m²
Apartments
apt.
Transaction amount
10th percentile
1 288 
113 K
680 
70 500 
20th percentile
1 453 
139 K
741 
81 000 
30th percentile
1 595 
149 K
803 
91 500 
40th percentile
1 805 
191 K
880 
98 800 
50th percentile
1 848 
201 K
965 
105 K
60th percentile
1 984 
204 K
1 050 
110 K
70th percentile
2 097 
221 K
1 123 
115 K
80th percentile
2 253 
236 K
1 171 
119 K
90th percentile
2 362 
325 K
1 219 
123 K

National and departmental comparison

Evolution of the median price per m² of houses

Evolution of the median price per m² of apartments

Quarterly evolution

Evolution of the median price per m²

Evolution of the number of transactions

Quarterly data

Descending order
Quarter
Houses
house
transactions
Houses
house
Price per m²
Apartments
apt.
transactions
Apartments
apt.
Price per m²
2025 Q1
11
1 784 
0
--- 
2024 Q4
4
2 142 
0
--- 
2024 Q3
7
1 850 
1
1 107 
2024 Q2
5
958 
0
--- 
2024 Q1
7
1 768 
1
1 267 
2023 Q4
5
1 761 
0
--- 
2023 Q3
8
1 948 
0
--- 
2023 Q2
6
1 427 
0
--- 
2023 Q1
8
1 822 
0
--- 
2022 Q4
10
1 480 
0
--- 
2022 Q3
7
1 750 
0
--- 
2022 Q2
5
1 500 
0
--- 
2022 Q1
3
1 375 
0
--- 
2021 Q4
4
984 
0
--- 
2021 Q3
12
1 718 
0
--- 
2021 Q2
9
1 579 
0
--- 
2021 Q1
4
1 586 
0
--- 
2020 Q4
7
1 819 
0
--- 
2020 Q3
5
1 566 
0
--- 
2020 Q2
4
1 354 
0
--- 
2020 Q1
7
1 522 
0
--- 
2019 Q4
4
1 552 
0
--- 
2019 Q3
6
1 638 
0
--- 
2019 Q2
6
980 
1
619 
2019 Q1
6
1 149 
0
--- 
2018 Q4
6
1 291 
0
--- 
2018 Q3
7
1 406 
1
823 
2018 Q2
4
1 320 
0
--- 
2018 Q1
4
1 200 
0
--- 
2017 Q4
2
1 162 
0
--- 
2017 Q3
6
875 
0
--- 
2017 Q2
1
2 747 
0
--- 
2017 Q1
4
894 
0
--- 
2016 Q4
3
391 
0
--- 
2016 Q3
5
1 055 
0
--- 
2016 Q2
6
542 
0
--- 
2016 Q1
3
771 
0
--- 
2015 Q4
2
1 132 
0
--- 
2015 Q3
8
1 244 
0
--- 
2015 Q2
3
1 774 
0
--- 
2015 Q1
1
885 
0
--- 
2014 Q4
3
1 362 
0
--- 
2014 Q3
9
1 223 
0
--- 
2014 Q2
9
1 278 
0
--- 
2014 Q1
5
1 214 
0
--- 

Overview of the latest real estate transactions

The following list is an anonymized overview of the latest transactions. For more details and to find all transactions, please use the map to view transactions by plot or the transaction search page for a search by criteria.

2025-04-14
99 000 
Sale
Land
435 m2
-Sols
2025-04-07
10 000 
Sale
Land
5533 m2
-Prés
2025-03-29
240 000 
1 558  /m²(154 m²)
Sale
Houses
House
5 rooms
154 m2
Land
812 m2
-Sols
2025-03-29
221 000 
2 570  /m²(86 m²)
Sale
Houses
House
4 rooms
86 m2
Land
495 m2
-Sols
2025-03-27
200 000 
2 273  /m²(88 m²)
Sale
Houses
House
4 rooms
88 m2
1 outbuilding
Land
1000 m2
-Sols
Land
1450 m2
-Terrains d'agrément
2025-03-21
120 000 
Sale
Land
2596 m2
-Terres
Land
787 m2
-Vergers
Land
1271 m2
-Prés
2025-03-21
220 968 
2 065  /m²(107 m²)
Sale
Houses
House
6 rooms
107 m2
Land
532 m2
-Sols
2025-03-14
202 000 
1 836  /m²(110 m²)
Sale
Houses
House
4 rooms
110 m2
1 outbuilding
Land
448 m2
-Sols
Land
176 m2
-Sols
2025-03-10
78 500 
1 784  /m²(44 m²)
Sale
Houses
House
2 rooms
44 m2
Land
174 m2
-Sols
2025-03-05
326 600 
2 333  /m²(140 m²)
Sale
Houses
House
6 rooms
140 m2
1 outbuilding
Land
1380 m2
-Sols
Land
3560 m2
-Prés
Land
29023 m2
-Prés
Land
850 m2
-Jardins
Land
4190 m2
-Vergers
2025-02-25
150 000 
647  /m²(232 m²)
Sale
Apartments
Apartment
4 rooms
81 m2
Apartments
Apartment
4 rooms
81 m2
Houses
House
3 rooms
70 m2
3 outbuildings
Land
1341 m2
-Sols
Land
416 m2
-Prés
Land
330 m2
-Vergers
Land
440 m2
-Jardins
Land
768 m2
-Vergers
2025-01-31
315 000 
1 479  /m²(213 m²)
Sale
Houses
House
8 rooms
213 m2
Land
1306 m2
-Prés
Land
1000 m2
-Sols
2025-01-31
80 000 
114  /m²(700 m²)
Sale
Commercial property
300 m2
Commercial property
100 m2
Commercial property
300 m2
2 outbuildings
Land
3008 m2
-Sols
2025-01-24
185 000 
1 682  /m²(110 m²)
Sale
Houses
House
6 rooms
110 m2
Land
769 m2
-Sols
2025-01-09
135 000 
1 378  /m²(98 m²)
Sale
Houses
House
5 rooms
98 m2
Land
502 m2
-Sols
2024-12-30
76 000 
916  /m²(83 m²)
Sale
Houses
House
1 room
83 m2
Land
931 m2
-Sols
2024-12-23
190 000 
391  /m²(486 m²)
Sale
Commercial property
486 m2
Land
3531 m2
-Sols
2024-12-10
1 
Sale
Land
13138 m2
-Prés
2024-12-02
83 650 
Sale
Land
37750 m2
-Terres
Land
13950 m2
-Vergers
Land
36528 m2
-Prés
Land
9302 m2
-Prés
Land
18650 m2
-Prés
Land
16800 m2
-Terres
Land
3320 m2
-Vergers
Land
3394 m2
-Prés
Land
21406 m2
-Prés
2024-11-29
204 800 
2 111  /m²(97 m²)
Sale
Houses
House
5 rooms
97 m2
Land
2420 m2
-Terrains d'agrément
Land
1990 m2
-Sols
474 transactions listed in the municipality

Mayenne (53)

Most expensive cities

City
name
Descending orderHouses
house
Price per m²
2 368 
2 117 
2 030 
2 029 
1 989 
1 983 
1 920 
1 910 
City
name
Descending orderApartments
apt.
Price per m²
2 497 
2 138 
2 093 
1 992 
1 951 
1 597 
1 481 

Least expensive cities

City
name
Ascending orderHouses
house
Price per m²
594 
686 
694 
719 
City
name
Ascending orderApartments
apt.
Price per m²
151 
151 
156 
170 
202