emooki
HomePrice mapTransactions
🇬🇧 English🇫🇷 Français🇩🇪 Deutsch🇪🇸 Español🇮🇹 Italiano

Real estate price map


Real estate price map in the municipality of Louverné.

Mayenne (53)
Louverné

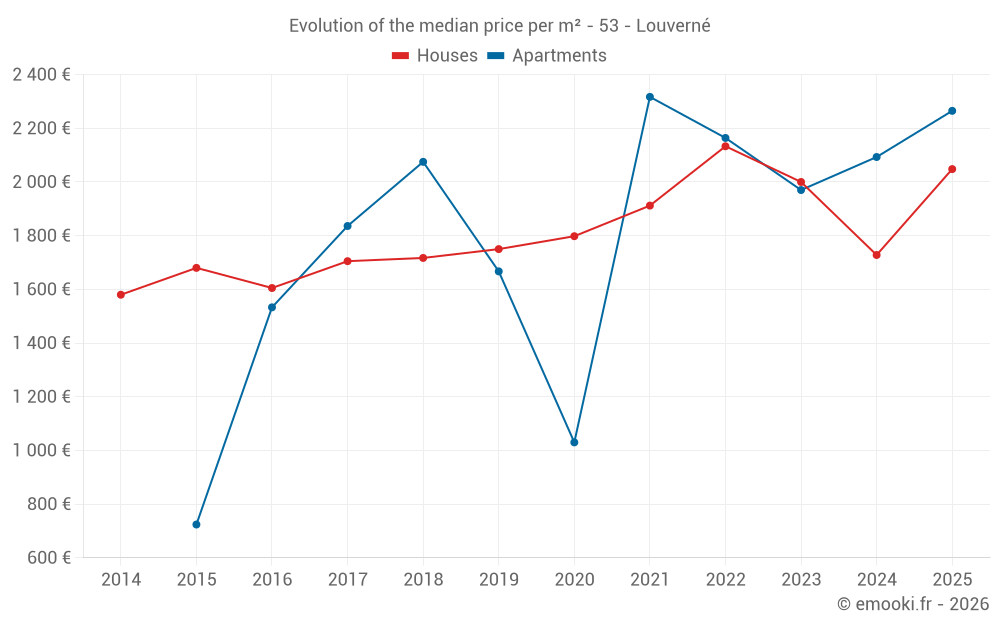
Median price of real estate
in the municipality of Louverné

HousesHouses
2 030  /m²
1-23-45-67-89-10
Reliability 8/10
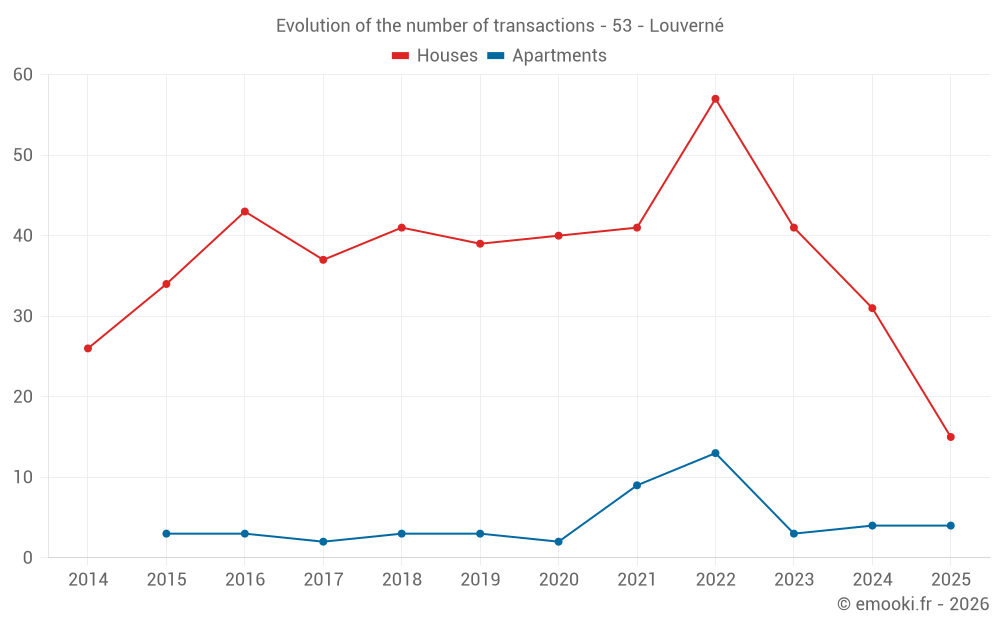
Median price on the 33 transactions of the last 12 months.
from 1 654 to
2 300  /m²
60% of transactions from the 2nd to the 8th deciles.
ApartmentsApartments
2 093  /m²
1-23-45-67-89-10
Reliability 6/10
Median price on the 21 transactions of the last 36 months.
from 1 818 to
2 507  /m²
60% of transactions from the 2nd to the 8th deciles.
DwellingsDwellings
2 048  /m²
1-23-45-67-89-10
Reliability 9/10
Median price on the 19 transactions of the last 6 months.
from 1 792 to
2 484  /m²
60% of transactions from the 2nd to the 8th deciles.
HousesEvolution of the price per m² of houses since...
1 year
+19%
2 years
+2.4%
3 years
-4%
4 years
+7.1%
5 years
+14%
6 years
+17%
7 years
+19%
8 years
+20%
9 years
+28%
10 years
+22%
11 years
+30%
ApartmentsEvolution of the price per m² of apartments since...
1 year
--
2 years
--
3 years
--
4 years
--
5 years
--
6 years
--
7 years
--
8 years
--
9 years
--
10 years
--
11 years
--

Yearly evolution

Evolution of the median price per m²

Evolution of the number of transactions

Warning, last year incomplete. Projections made based on the proportions between semesters of the previous year at the departmental/national level and by type of property.

Yearly data

Descending order
Year
Houses
house
transactions
Houses
house
Price per m²
Apartments
apt.
transactions
Apartments
apt.
Price per m²
2025
15
2 048 
4
2 265 
2024
31
1 728 
4
2 093 
2023
41
2 000 
3
1 970 
2022
57
2 133 
13
2 164 
2021
41
1 912 
9
2 317 
2020
40
1 798 
2
1 030 
2019
39
1 750 
3
1 667 
2018
41
1 717 
3
2 075 
2017
37
1 705 
2
1 836 
2016
43
1 605 
3
1 533 
2015
34
1 680 
3
724 
2014
26
1 580 
0
--- 

Analysis

Structure of prices per m²

Values of price percentiles per m² over the periods used for the estimated price of each type of property.

Structure of transaction amounts

Values of transaction amounts percentiles over the periods used for the estimated price of each type of property.

Transaction amounts and prices per m² by percentile

Ascending order
Percentile
Houses
house
Price per m²
Houses
house
Transaction amount
Apartments
apt.
Price per m²
Apartments
apt.
Transaction amount
10th percentile
1 093 
90 200 
1 689 
85 000 
20th percentile
1 654 
103 K
1 818 
89 500 
30th percentile
1 744 
130 K
1 970 
90 000 
40th percentile
1 878 
145 K
2 031 
130 K
50th percentile
2 030 
173 K
2 093 
135 K
60th percentile
2 090 
184 K
2 164 
150 K
70th percentile
2 202 
199 K
2 346 
152 K
80th percentile
2 300 
209 K
2 507 
156 K
90th percentile
2 697 
224 K
2 559 
188 K

National and departmental comparison

Evolution of the median price per m² of houses

Evolution of the median price per m² of apartments

Quarterly evolution

Evolution of the median price per m²

Evolution of the number of transactions

Quarterly data

Descending order
Quarter
Houses
house
transactions
Houses
house
Price per m²
Apartments
apt.
transactions
Apartments
apt.
Price per m²
2025 Q2
2
1 598 
2
1 920 
2025 Q1
13
2 100 
2
2 533 
2024 Q4
10
1 752 
1
775 
2024 Q3
8
2 208 
0
--- 
2024 Q2
5
1 625 
0
--- 
2024 Q1
8
1 456 
3
2 093 
2023 Q4
6
2 058 
0
--- 
2023 Q3
13
2 173 
1
1 889 
2023 Q2
10
1 932 
1
1 970 
2023 Q1
12
1 992 
1
2 400 
2022 Q4
14
2 162 
3
2 346 
2022 Q3
20
2 126 
7
2 110 
2022 Q2
14
1 903 
2
2 136 
2022 Q1
9
2 327 
1
2 457 
2021 Q4
12
2 008 
2
2 568 
2021 Q3
7
1 833 
2
2 198 
2021 Q2
16
1 937 
3
2 333 
2021 Q1
6
1 925 
2
1 746 
2020 Q4
15
2 066 
0
--- 
2020 Q3
8
1 673 
1
1 125 
2020 Q2
8
1 780 
1
934 
2020 Q1
9
1 743 
0
--- 
2019 Q4
7
1 270 
1
1 674 
2019 Q3
13
1 818 
0
--- 
2019 Q2
10
1 818 
1
1 508 
2019 Q1
9
1 618 
1
1 667 
2018 Q4
10
1 677 
1
2 083 
2018 Q3
12
1 873 
1
1 523 
2018 Q2
14
1 522 
1
2 075 
2018 Q1
5
1 717 
0
--- 
2017 Q4
18
1 717 
0
--- 
2017 Q3
6
1 742 
0
--- 
2017 Q2
4
1 704 
0
--- 
2017 Q1
9
1 488 
2
1 836 
2016 Q4
15
1 605 
0
--- 
2016 Q3
13
1 400 
0
--- 
2016 Q2
10
1 685 
1
1 935 
2016 Q1
5
1 606 
2
1 065 
2015 Q4
12
1 660 
1
724 
2015 Q3
11
1 477 
1
526 
2015 Q2
4
2 002 
0
--- 
2015 Q1
7
1 765 
1
950 
2014 Q4
7
1 500 
0
--- 
2014 Q3
4
1 242 
0
--- 
2014 Q2
7
1 698 
0
--- 
2014 Q1
8
1 776 
0
--- 

Mayenne (53)

Most expensive cities

City
name
Descending orderHouses
house
Price per m²
2 368 
2 117 
2 030 
2 029 
1 989 
1 983 
1 920 
1 910 
City
name
Descending orderApartments
apt.
Price per m²
2 497 
2 138 
2 093 
1 992 
1 951 
1 597 
1 481 

Least expensive cities

City
name
Ascending orderHouses
house
Price per m²
594 
686 
694 
719 
City
name
Ascending orderApartments
apt.
Price per m²
151 
151 
156 
170 
202