emooki
HomePrice mapTransactions
🇬🇧 English🇫🇷 Français🇩🇪 Deutsch🇪🇸 Español🇮🇹 Italiano

Real estate price map


Real estate price map in the municipality of Rives-du-Loir-en-Anjou.

Maine-et-Loire (49)
Rives-du-Loir-en-Anjou

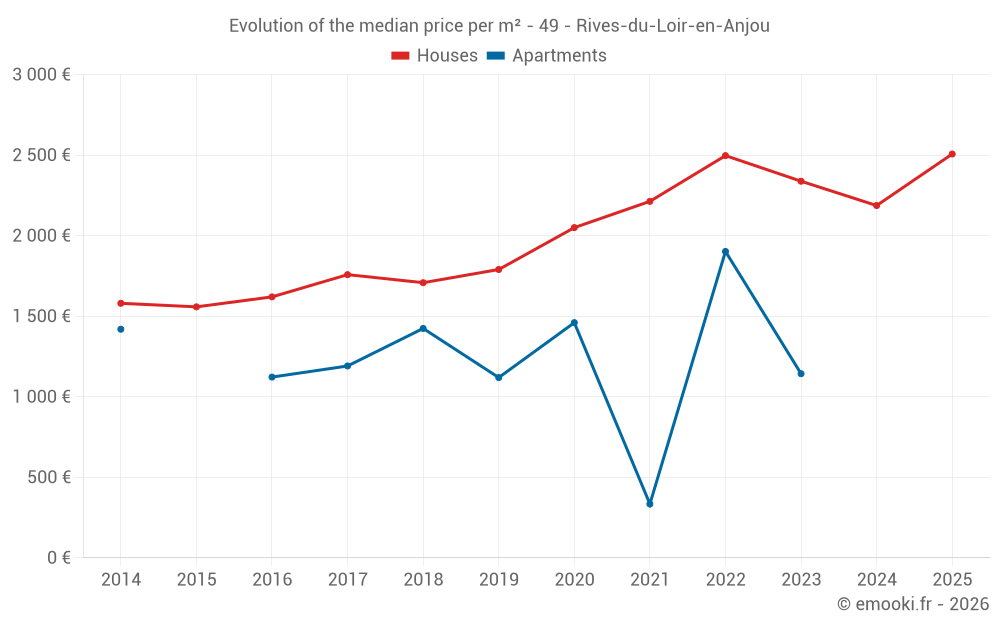
Median price of real estate
in the municipality of Rives-du-Loir-en-Anjou

HousesHouses
2 253 € /m²
1-23-45-67-89-10
Reliability 8/10
Median price on the 49 transactions of the last 12 months.
from 1 726 to
2 726 € /m²
60% of transactions from the 2nd to the 8th deciles.
ApartmentsApartments
1 302 € /m²
1-23-45-67-89-10
Reliability 3/10
Median price on the 6 transactions of the last 72 months.
DwellingsDwellings
2 253 € /m²
1-23-45-67-89-10
Reliability 8/10
Median price on the 49 transactions of the last 12 months.
from 1 726 to
2 726 € /m²
60% of transactions from the 2nd to the 8th deciles.
HousesEvolution of the price per m² of houses
1 year
+15%
2 years
+7.2%
3 years
+0.4%
4 years
+13%
5 years
+22%
6 years
+40%
7 years
+47%
8 years
+43%
9 years
+55%
10 years
+61%
11 years
+59%
ApartmentsEvolution of the price per m² of apartments
1 year
--
2 years
--
3 years
--
4 years
--
5 years
--
6 years
--
7 years
--
8 years
--
9 years
--
10 years
--
11 years
--

Yearly evolution

Median price per m²

Number of transactions

Warning, last year incomplete. Projections made based on the proportions between semesters of the previous year at the departmental/national level and by type of property.

Yearly data

Descending order
Year
Houses
house
Price per m²
Houses
house
transactions
Apartments
apt.
Price per m²
Apartments
apt.
transactions
2025
2 507 €
16
--- €
0
2024
2 187 €
58
--- €
0
2023
2 338 €
46
1 143 €
3
2022
2 497 €
83
1 902 €
1
2021
2 213 €
69
334 €
1
2020
2 050 €
72
1 460 €
1
2019
1 790 €
66
1 119 €
1
2018
1 708 €
54
1 424 €
2
2017
1 758 €
59
1 191 €
2
2016
1 620 €
46
1 122 €
2
2015
1 558 €
42
--- €
0
2014
1 580 €
36
1 419 €
4

Analysis

Structure of prices per m²

Values of price percentiles per m² over the periods used for the estimated price of each type of property.

Structure of transaction amounts

Values of transaction amounts percentiles over the periods used for the estimated price of each type of property.

Transaction amounts and prices per m² by percentile

Ascending order
Percentile
Houses
house
Price per m²
Houses
house
Transaction amount
Apartments
apt.
Price per m²
Apartments
apt.
Transaction amount
10th percentile
1 514 €
152 008 €
517 €
61 656 €
20th percentile
1 726 €
184 500 €
700 €
81 250 €
30th percentile
2 037 €
205 000 €
922 €
102 864 €
40th percentile
2 160 €
225 000 €
1 143 €
124 479 €
50th percentile
2 253 €
240 000 €
1 302 €
142 240 €
60th percentile
2 429 €
269 000 €
1 460 €
160 000 €
70th percentile
2 535 €
289 600 €
1 681 €
167 500 €
80th percentile
2 726 €
346 000 €
1 902 €
175 000 €
90th percentile
2 981 €
411 000 €
1 939 €
287 500 €

Quarterly evolution

Median price per m²

Number of transactions

Quarterly data

Descending order
Quarter
Houses
house
Price per m²
Houses
house
transactions
Apartments
apt.
Price per m²
Apartments
apt.
transactions
2025 Q2
2 957 €
5
--- €
0
2025 Q1
2 253 €
11
--- €
0
2024 Q4
1 992 €
18
--- €
0
2024 Q3
2 346 €
15
--- €
0
2024 Q2
2 203 €
11
--- €
0
2024 Q1
1 984 €
14
--- €
0
2023 Q4
1 877 €
12
1 143 €
1
2023 Q3
2 506 €
9
1 976 €
1
2023 Q2
2 624 €
13
--- €
0
2023 Q1
2 204 €
12
700 €
1
2022 Q4
2 505 €
19
--- €
0
2022 Q3
2 547 €
25
--- €
0
2022 Q2
2 417 €
21
1 902 €
1
2022 Q1
2 388 €
18
--- €
0
2021 Q4
2 439 €
17
--- €
0
2021 Q3
1 852 €
17
334 €
1
2021 Q2
2 420 €
20
--- €
0
2021 Q1
2 095 €
15
--- €
0
2020 Q4
2 193 €
17
--- €
0
2020 Q3
2 102 €
22
1 460 €
1
2020 Q2
2 038 €
21
--- €
0
2020 Q1
1 984 €
12
--- €
0
2019 Q4
1 908 €
17
--- €
0
2019 Q3
1 722 €
20
--- €
0
2019 Q2
1 746 €
20
--- €
0
2019 Q1
1 935 €
9
1 119 €
1
2018 Q4
1 826 €
12
1 698 €
1
2018 Q3
1 423 €
17
1 151 €
1
2018 Q2
1 719 €
15
--- €
0
2018 Q1
1 786 €
10
--- €
0
2017 Q4
1 764 €
18
--- €
0
2017 Q3
1 786 €
16
--- €
0
2017 Q2
1 392 €
13
1 191 €
2
2017 Q1
1 963 €
12
--- €
0
2016 Q4
1 922 €
17
1 070 €
1
2016 Q3
1 593 €
14
1 174 €
1
2016 Q2
1 211 €
7
--- €
0
2016 Q1
1 344 €
8
--- €
0
2015 Q4
1 554 €
12
--- €
0
2015 Q3
1 736 €
15
--- €
0
2015 Q2
1 254 €
5
--- €
0
2015 Q1
1 880 €
10
--- €
0
2014 Q4
1 413 €
3
--- €
0
2014 Q3
1 678 €
13
1 167 €
1
2014 Q2
1 628 €
8
1 434 €
2
2014 Q1
1 553 €
12
1 671 €
1

Maine-et-Loire (49)

Most expensive cities

City
name
Descending orderHouses
house
Price per m²
3 368 €
3 054 €
2 990 €
2 934 €
2 863 €
2 814 €
2 738 €
2 724 €
2 666 €
2 644 €
City
name
Descending orderApartments
apt.
Price per m²
3 544 €
3 331 €
3 200 €
2 892 €
2 807 €
2 770 €
2 728 €
2 634 €
2 576 €

Least expensive cities

City
name
Ascending orderHouses
house
Price per m²
729 €
783 €
897 €
961 €
974 €
1 003 €
1 016 €
1 026 €
1 035 €
1 048 €
City
name
Ascending orderApartments
apt.
Price per m²
123 €
208 €
382 €
382 €
412 €
417 €
441 €
442 €
475 €
478 €