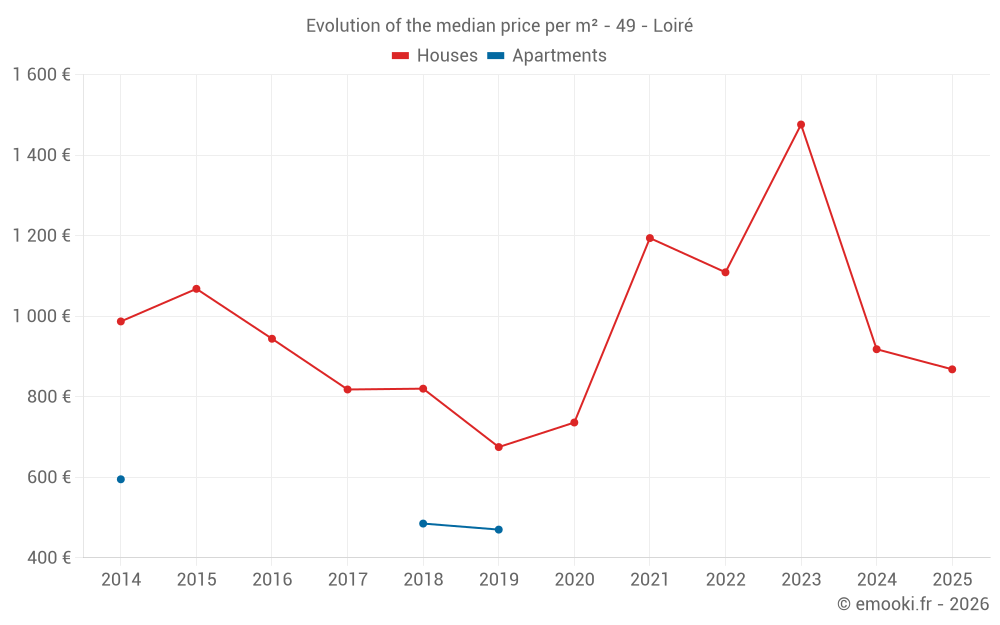
Median price of real estate
in the municipality of Loiré
Houses
961 € /m²
Reliability 7/10
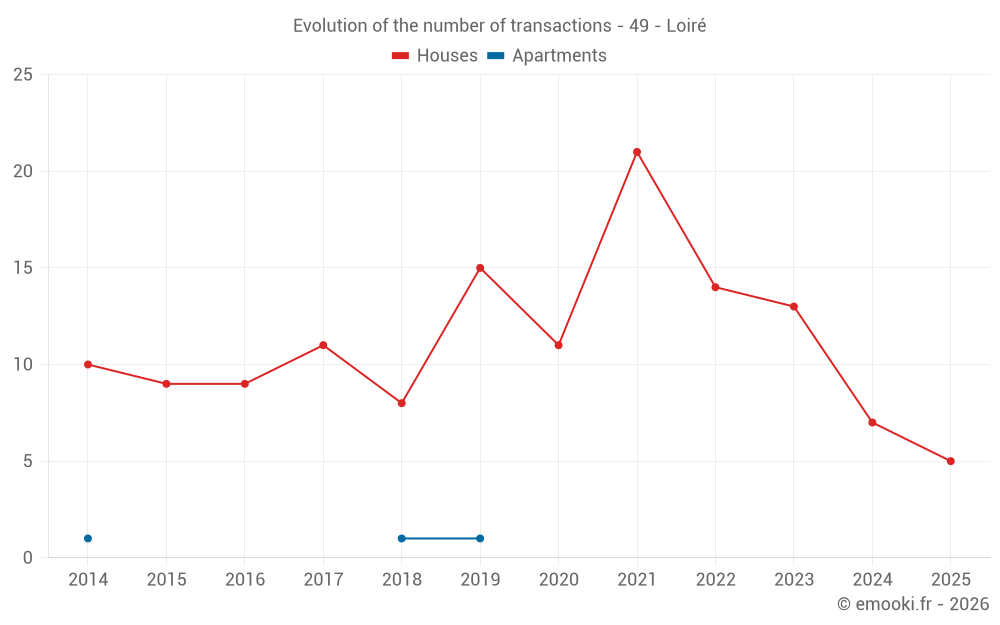
Median price on the 18 transactions of the last 24 months.
from 847 to
1 469 € /m²
1 469 € /m²
60% of transactions from the 2nd to the 8th deciles.
Apartments
478 € /m²
Reliability 1/10
Median price on the 2 transactions of the last 120 months.
Dwellings
961 € /m²
Reliability 7/10
Median price on the 18 transactions of the last 24 months.
from 847 to
1 469 € /m²
1 469 € /m²
60% of transactions from the 2nd to the 8th deciles.