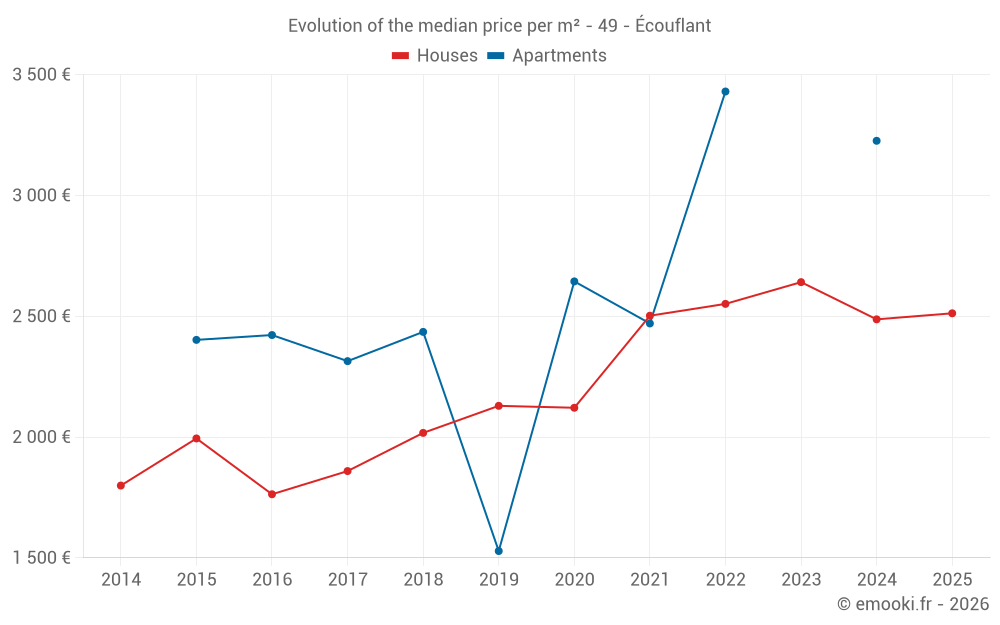
Median price of real estate
in the municipality of Écouflant
Houses
2 474 € /m²
Reliability 8/10
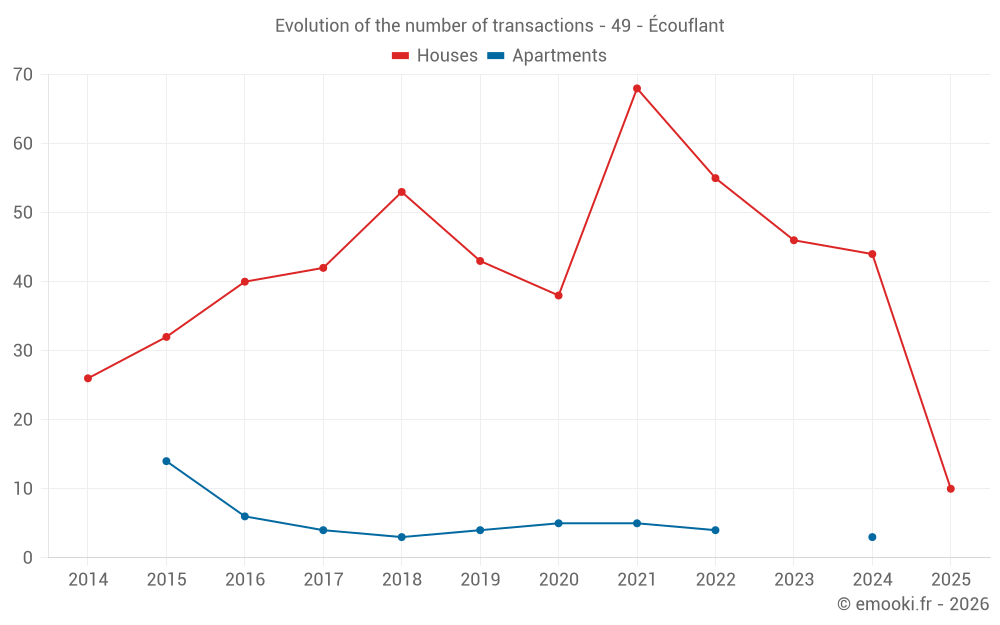
Median price on the 31 transactions of the last 12 months.
from 2 056 to
2 795 € /m²
2 795 € /m²
60% of transactions from the 2nd to the 8th deciles.
Apartments
2 892 € /m²
Reliability 4/10
Median price on the 17 transactions of the last 60 months.
from 2 531 to
3 345 € /m²
3 345 € /m²
60% of transactions from the 2nd to the 8th deciles.
Dwellings
2 474 € /m²
Reliability 8/10
Median price on the 31 transactions of the last 12 months.
from 2 056 to
2 795 € /m²
2 795 € /m²
60% of transactions from the 2nd to the 8th deciles.