emooki
HomePrice mapTransactions
🇬🇧 English🇫🇷 Français🇩🇪 Deutsch🇪🇸 Español🇮🇹 Italiano

Real estate price map


Real estate price map in the municipality of Verrières-en-Anjou.

Maine-et-Loire (49)
Verrières-en-Anjou

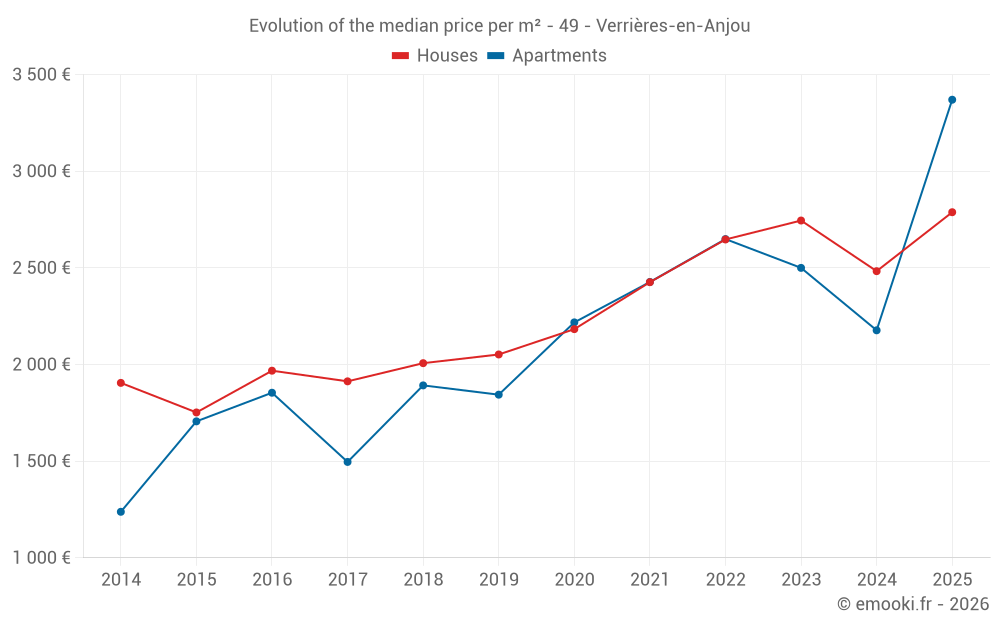
Median price of real estate
in the municipality of Verrières-en-Anjou

HousesHouses
2 497  /m²
1-23-45-67-89-10
Reliability 8/10
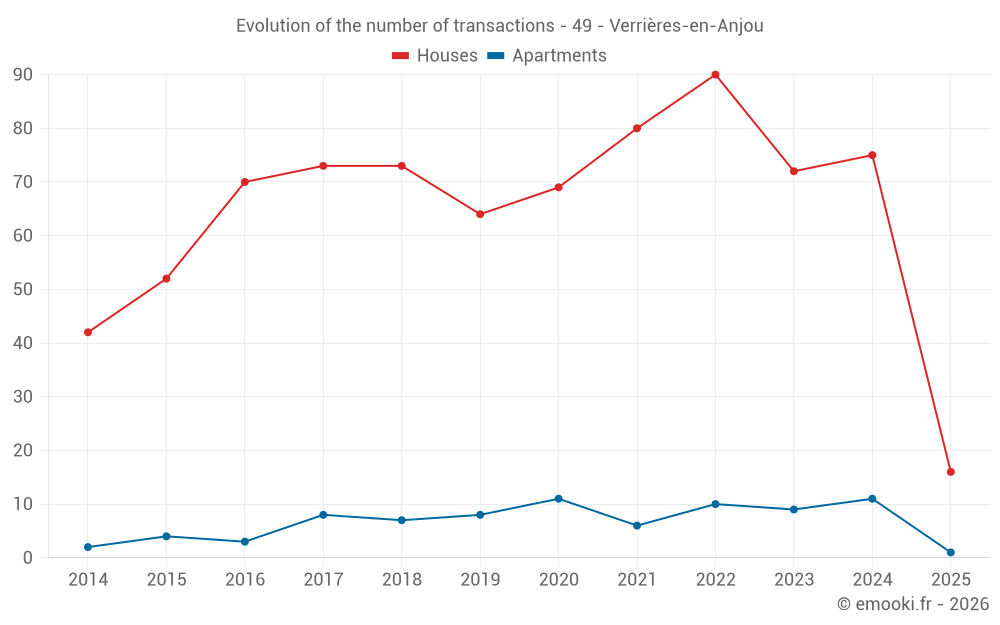
Median price on the 66 transactions of the last 12 months.
from 2 148 to
3 053  /m²
60% of transactions from the 2nd to the 8th deciles.
ApartmentsApartments
2 384  /m²
1-23-45-67-89-10
Reliability 7/10
Median price on the 19 transactions of the last 24 months.
from 2 115 to
2 807  /m²
60% of transactions from the 2nd to the 8th deciles.
DwellingsDwellings
2 487  /m²
1-23-45-67-89-10
Reliability 8/10
Median price on the 74 transactions of the last 12 months.
from 2 139 to
3 043  /m²
60% of transactions from the 2nd to the 8th deciles.
HousesEvolution of the price per m² of houses since...
1 year
+12%
2 years
+1.6%
3 years
+5.3%
4 years
+15%
5 years
+28%
6 years
+36%
7 years
+39%
8 years
+46%
9 years
+42%
10 years
+59%
11 years
+46%
ApartmentsEvolution of the price per m² of apartments since...
1 year
--
2 years
--
3 years
--
4 years
--
5 years
--
6 years
--
7 years
--
8 years
--
9 years
--
10 years
--
11 years
--

Yearly evolution

Evolution of the median price per m²

Evolution of the number of transactions

Warning, last year incomplete. Projections made based on the proportions between semesters of the previous year at the departmental/national level and by type of property.

Yearly data

Descending order
Year
Houses
house
transactions
Houses
house
Price per m²
Apartments
apt.
transactions
Apartments
apt.
Price per m²
2025
16
2 788 
1
3 370 
2024
75
2 483 
11
2 177 
2023
72
2 745 
9
2 500 
2022
90
2 647 
10
2 649 
2021
80
2 426 
6
2 427 
2020
69
2 183 
11
2 218 
2019
64
2 052 
8
1 844 
2018
73
2 007 
7
1 892 
2017
73
1 913 
8
1 496 
2016
70
1 968 
3
1 854 
2015
52
1 752 
4
1 706 
2014
42
1 905 
2
1 238 

Analysis

Structure of prices per m²

Values of price percentiles per m² over the periods used for the estimated price of each type of property.

Structure of transaction amounts

Values of transaction amounts percentiles over the periods used for the estimated price of each type of property.

Transaction amounts and prices per m² by percentile

Ascending order
Percentile
Houses
house
Price per m²
Houses
house
Transaction amount
Apartments
apt.
Price per m²
Apartments
apt.
Transaction amount
10th percentile
1 910 
177 K
2 026 
131 K
20th percentile
2 148 
195 K
2 115 
133 K
30th percentile
2 313 
213 K
2 158 
135 K
40th percentile
2 376 
234 K
2 238 
143 K
50th percentile
2 497 
241 K
2 384 
155 K
60th percentile
2 721 
260 K
2 486 
161 K
70th percentile
2 908 
288 K
2 593 
171 K
80th percentile
3 053 
350 K
2 807 
175 K
90th percentile
3 164 
419 K
2 946 
182 K

National and departmental comparison

Evolution of the median price per m² of houses

Evolution of the median price per m² of apartments

Quarterly evolution

Evolution of the median price per m²

Evolution of the number of transactions

Quarterly data

Descending order
Quarter
Houses
house
transactions
Houses
house
Price per m²
Apartments
apt.
transactions
Apartments
apt.
Price per m²
2025 Q2
4
2 797 
1
3 370 
2025 Q1
12
2 788 
0
--- 
2024 Q4
15
2 480 
3
2 093 
2024 Q3
35
2 433 
4
2 518 
2024 Q2
10
2 597 
2
2 172 
2024 Q1
15
2 614 
2
2 302 
2023 Q4
14
2 514 
4
2 416 
2023 Q3
17
2 852 
3
2 840 
2023 Q2
23
2 809 
2
2 414 
2023 Q1
18
2 498 
0
--- 
2022 Q4
19
2 460 
0
--- 
2022 Q3
20
2 636 
4
2 558 
2022 Q2
27
2 810 
3
2 782 
2022 Q1
24
2 704 
3
2 516 
2021 Q4
23
2 537 
1
2 423 
2021 Q3
34
2 364 
1
2 431 
2021 Q2
15
2 400 
2
2 496 
2021 Q1
8
2 704 
2
2 225 
2020 Q4
18
2 198 
3
2 218 
2020 Q3
18
2 184 
3
2 256 
2020 Q2
15
2 077 
4
2 080 
2020 Q1
18
2 191 
1
1 936 
2019 Q4
19
2 059 
2
1 904 
2019 Q3
22
2 060 
3
1 812 
2019 Q2
10
2 060 
1
1 972 
2019 Q1
13
2 045 
2
1 928 
2018 Q4
22
2 206 
2
1 905 
2018 Q3
21
2 041 
2
1 933 
2018 Q2
13
1 985 
3
1 319 
2018 Q1
17
1 794 
0
--- 
2017 Q4
22
1 956 
3
1 756 
2017 Q3
18
1 792 
1
1 528 
2017 Q2
15
1 886 
3
1 460 
2017 Q1
18
2 018 
1
1 923 
2016 Q4
23
1 973 
2
1 842 
2016 Q3
23
1 951 
1
2 058 
2016 Q2
13
1 972 
0
--- 
2016 Q1
11
2 049 
0
--- 
2015 Q4
13
1 864 
1
1 528 
2015 Q3
18
1 812 
2
1 226 
2015 Q2
13
1 685 
0
--- 
2015 Q1
8
1 547 
1
1 884 
2014 Q4
9
1 833 
1
1 349 
2014 Q3
11
1 929 
0
--- 
2014 Q2
11
1 922 
1
1 127 
2014 Q1
11
1 888 
0
--- 

Maine-et-Loire (49)

Most expensive cities

City
name
Descending orderHouses
house
Price per m²
3 368 
2 990 
2 863 
2 738 
2 666 
City
name
Descending orderApartments
apt.
Price per m²
3 544 
3 331 
3 200 
2 892 
2 770 
2 728 
2 634 
2 576 

Least expensive cities

City
name
Ascending orderHouses
house
Price per m²
783 
961 
1 016 
1 026 
1 035 
1 048 
City
name
Ascending orderApartments
apt.
Price per m²
123 
208 
382 
441 
478