emooki
HomePrice mapTransactions
🇬🇧 English🇫🇷 Français🇩🇪 Deutsch🇪🇸 Español🇮🇹 Italiano

Real estate price map


Real estate price map in the municipality of Tiercé.

Maine-et-Loire (49)
Tiercé

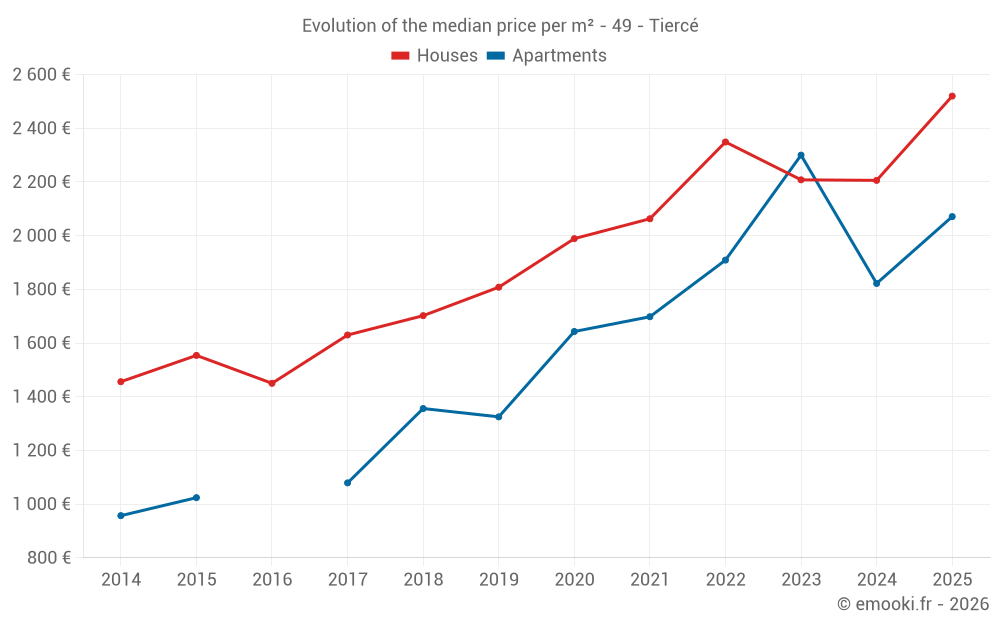
Median price of real estate
in the municipality of Tiercé

HousesHouses
2 233 € /m²
1-23-45-67-89-10
Reliability 8/10
Median price on the 51 transactions of the last 12 months.
from 1 899 to
2 895 € /m²
60% of transactions from the 2nd to the 8th deciles.
ApartmentsApartments
1 940 € /m²
1-23-45-67-89-10
Reliability 6/10
Median price on the 17 transactions of the last 36 months.
from 1 848 to
2 308 € /m²
60% of transactions from the 2nd to the 8th deciles.
DwellingsDwellings
2 444 € /m²
1-23-45-67-89-10
Reliability 9/10
Median price on the 22 transactions of the last 6 months.
from 1 968 to
2 907 € /m²
60% of transactions from the 2nd to the 8th deciles.
HousesEvolution of the price per m² of houses
1 year
+14%
2 years
+14%
3 years
+7.3%
4 years
+22%
5 years
+27%
6 years
+39%
7 years
+48%
8 years
+55%
9 years
+74%
10 years
+62%
11 years
+73%
ApartmentsEvolution of the price per m² of apartments
1 year
--
2 years
-10%
3 years
+8.5%
4 years
+22%
5 years
+26%
6 years
+56%
7 years
+53%
8 years
--
9 years
--
10 years
--
11 years
--

Yearly evolution

Median price per m²

Number of transactions

Warning, last year incomplete. Projections made based on the proportions between semesters of the previous year at the departmental/national level and by type of property.

Yearly data

Descending order
Year
Houses
house
Price per m²
Houses
house
transactions
Apartments
apt.
Price per m²
Apartments
apt.
transactions
2025
2 520 €
17
2 071 €
5
2024
2 206 €
52
1 822 €
1
2023
2 208 €
43
2 300 €
5
2022
2 349 €
57
1 909 €
13
2021
2 063 €
61
1 698 €
13
2020
1 989 €
51
1 643 €
15
2019
1 808 €
53
1 325 €
12
2018
1 702 €
68
1 356 €
8
2017
1 630 €
42
1 079 €
1
2016
1 450 €
55
--- €
0
2015
1 554 €
46
1 024 €
4
2014
1 456 €
37
957 €
3

Quarterly evolution

Median price per m²

Number of transactions

Quarterly data

Descending order
Quarter
Houses
house
Price per m²
Houses
house
transactions
Apartments
apt.
Price per m²
Apartments
apt.
transactions
2025 Q2
2 558 €
6
2 244 €
1
2025 Q1
2 000 €
11
2 028 €
4
2024 Q4
2 125 €
18
1 822 €
1
2024 Q3
2 146 €
16
--- €
0
2024 Q2
2 312 €
8
--- €
0
2024 Q1
2 314 €
10
--- €
0
2023 Q4
1 992 €
13
2 310 €
3
2023 Q3
2 407 €
5
1 940 €
1
2023 Q2
2 345 €
16
--- €
0
2023 Q1
2 117 €
9
1 243 €
1
2022 Q4
2 706 €
14
1 909 €
3
2022 Q3
2 529 €
13
1 889 €
3
2022 Q2
2 164 €
18
2 333 €
3
2022 Q1
2 337 €
12
1 895 €
4
2021 Q4
2 186 €
21
1 756 €
3
2021 Q3
2 144 €
10
1 698 €
1
2021 Q2
2 237 €
16
1 520 €
4
2021 Q1
1 660 €
14
1 619 €
5
2020 Q4
1 986 €
15
1 705 €
5
2020 Q3
2 250 €
11
1 637 €
5
2020 Q2
2 050 €
12
1 649 €
2
2020 Q1
1 770 €
13
1 643 €
3
2019 Q4
2 051 €
10
1 333 €
3
2019 Q3
1 602 €
17
1 300 €
3
2019 Q2
1 677 €
14
1 317 €
3
2019 Q1
1 842 €
12
1 391 €
3
2018 Q4
1 723 €
15
1 356 €
4
2018 Q3
1 429 €
23
1 529 €
2
2018 Q2
1 668 €
22
1 222 €
2
2018 Q1
1 774 €
8
--- €
0
2017 Q4
1 472 €
8
--- €
0
2017 Q3
1 642 €
10
--- €
0
2017 Q2
1 650 €
16
--- €
0
2017 Q1
1 752 €
8
1 079 €
1
2016 Q4
1 947 €
8
--- €
0
2016 Q3
1 480 €
15
--- €
0
2016 Q2
955 €
19
--- €
0
2016 Q1
1 448 €
13
--- €
0
2015 Q4
1 586 €
12
--- €
0
2015 Q3
1 628 €
14
1 024 €
2
2015 Q2
1 649 €
8
1 288 €
1
2015 Q1
1 487 €
12
860 €
1
2014 Q4
1 535 €
14
--- €
0
2014 Q3
1 412 €
10
957 €
3
2014 Q2
1 286 €
5
--- €
0
2014 Q1
1 782 €
8
--- €
0

Analysis

Structure of prices per m²

Values of price percentiles per m² over the periods used for the estimated price of each type of property.

Maine-et-Loire (49)

Most expensive cities

City
name
Descending orderHouses
house
Price per m²
3 368 €
2 990 €
2 863 €
2 738 €
2 666 €
City
name
Descending orderApartments
apt.
Price per m²
3 544 €
3 331 €
3 200 €
2 892 €
2 770 €
2 728 €
2 634 €
2 576 €

Least expensive cities

City
name
Ascending orderHouses
house
Price per m²
783 €
961 €
1 016 €
1 026 €
1 035 €
1 048 €
City
name
Ascending orderApartments
apt.
Price per m²
123 €
208 €
382 €
441 €
478 €