emooki
HomePrice mapTransactions
🇬🇧 English🇫🇷 Français🇩🇪 Deutsch🇪🇸 Español🇮🇹 Italiano

Real estate price map


Real estate price map in the municipality of Thouaré-sur-Loire, choose a section to see transactions by parcel.

Loire-Atlantique (44)

Thouaré-sur-Loire - Real estate price m²

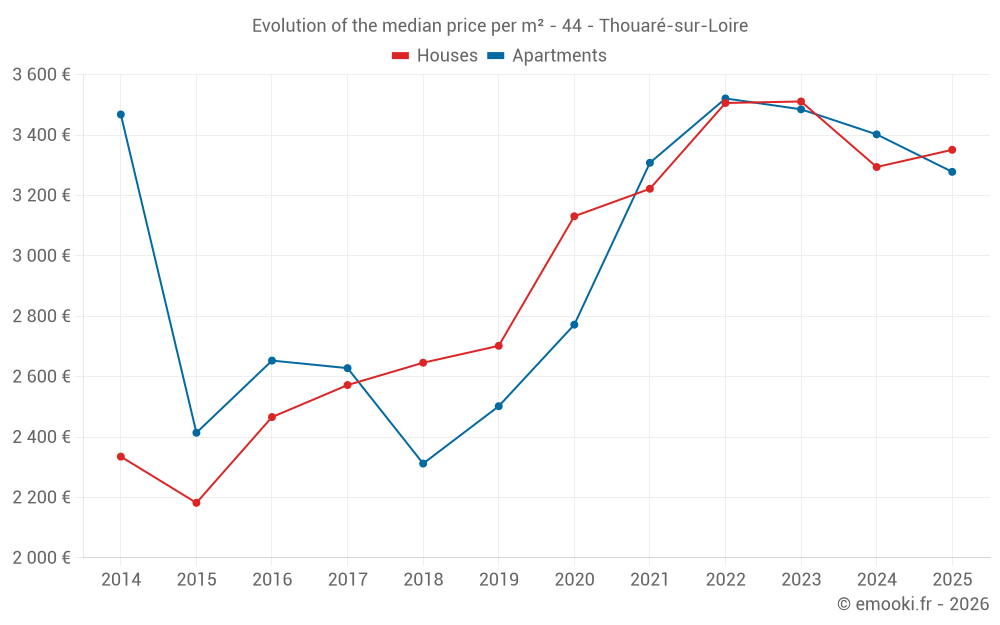
Median price of real estate
in the municipality of Thouaré-sur-Loire

HousesHouses
3 351  /m²
1-23-45-67-89-10
Reliability 9/10
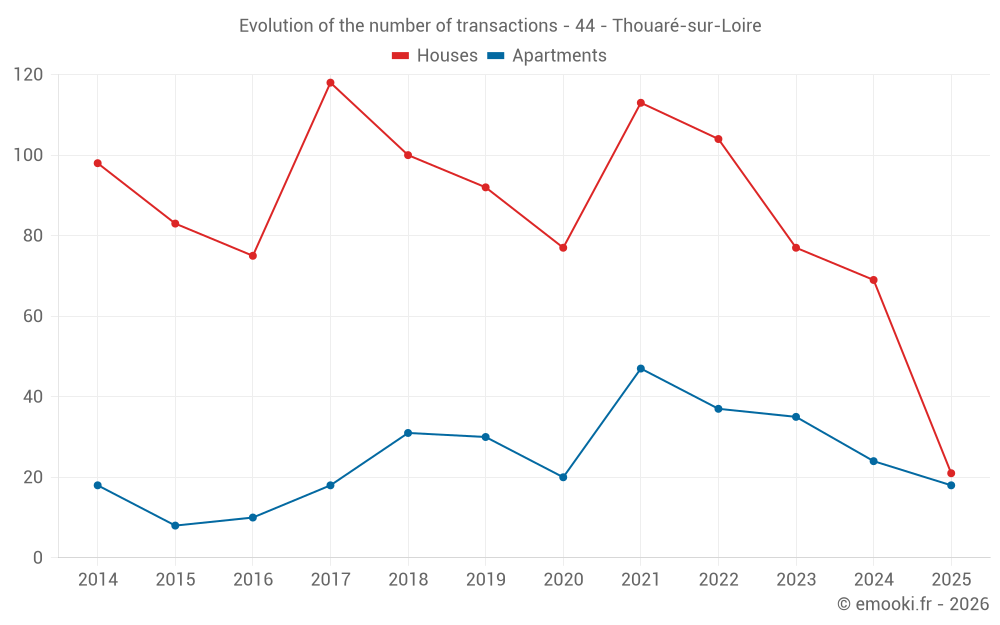
Median price on the 21 transactions of the last 6 months.
from 2 698 to
3 645  /m²
60% of transactions from the 2nd to the 8th deciles.
ApartmentsApartments
3 278  /m²
1-23-45-67-89-10
Reliability 9/10
Median price on the 18 transactions of the last 6 months.
from 2 986 to
3 627  /m²
60% of transactions from the 2nd to the 8th deciles.
DwellingsDwellings
3 312  /m²
1-23-45-67-89-10
Reliability 9/10
Median price on the 39 transactions of the last 6 months.
from 2 798 to
3 662  /m²
60% of transactions from the 2nd to the 8th deciles.
HousesEvolution of the price per m² of houses since...
1 year
+1.7%
2 years
-4.6%
3 years
-4.4%
4 years
+4%
5 years
+7%
6 years
+24%
7 years
+27%
8 years
+30%
9 years
+36%
10 years
+54%
11 years
+44%
The price per m² of houses has decreased by 4.6% since 2 years, but it has increased by 54% in 10 years.
ApartmentsEvolution of the price per m² of apartments since...
1 year
-3.6%
2 years
-5.9%
3 years
-6.9%
4 years
-0.9%
5 years
+18%
6 years
+31%
7 years
+42%
8 years
+25%
9 years
+24%
10 years
+36%
11 years
-5.5%
The price per m² of apartments has decreased by 6.9% since 3 years, but it has increased by 42% in 7 years.

Yearly evolution

Evolution of the median price per m²

Evolution of the median price per m² - 44 - Thouaré-sur-Loire

Evolution of the number of transactions

Warning, last year incomplete. Projections made based on the proportions between semesters of the previous year at the departmental/national level and by type of property.

Evolution of the number of transactions - 44 - Thouaré-sur-Loire

Yearly data

Descending order
Year
Houses
house
transactions
Houses
house
Price per m²
Apartments
apt.
transactions
Apartments
apt.
Price per m²
2025
21
3 351 
18
3 278 
2024
69
3 294 
24
3 402 
2023
77
3 511 
35
3 485 
2022
104
3 506 
37
3 521 
2021
113
3 222 
47
3 308 
2020
77
3 131 
20
2 772 
2019
92
2 702 
30
2 502 
2018
100
2 646 
31
2 312 
2017
118
2 572 
18
2 628 
2016
75
2 466 
10
2 653 
2015
83
2 182 
8
2 414 
2014
98
2 335 
18
3 468 

Analysis

Structure of prices per m²

Values of price percentiles per m² over the periods used for the estimated price of each type of property.

Structure of transaction amounts

Values of transaction amounts percentiles over the periods used for the estimated price of each type of property.

Transaction amounts and prices per m² by percentile

Ascending order
Percentile
Houses
house
Price per m²
Houses
house
Transaction amount
Apartments
apt.
Price per m²
Apartments
apt.
Transaction amount
10th percentile
2 242 
260 K
2 805 
129 K
20th percentile
2 698 
280 K
2 986 
133 K
30th percentile
2 838 
308 K
3 163 
140 K
40th percentile
3 143 
325 K
3 219 
141 K
50th percentile
3 351 
340 K
3 278 
148 K
60th percentile
3 457 
350 K
3 338 
153 K
70th percentile
3 562 
360 K
3 426 
186 K
80th percentile
3 645 
390 K
3 627 
225 K
90th percentile
3 927 
495 K
3 765 
235 K

National and departmental comparison

Evolution of the median price per m² of houses

Evolution of the median price per m² of apartments

Quarterly evolution

Evolution of the median price per m²

Evolution of the number of transactions

Quarterly data

Descending order
Quarter
Houses
house
transactions
Houses
house
Price per m²
Apartments
apt.
transactions
Apartments
apt.
Price per m²
2025 Q2
3
3 367 
8
3 291 
2025 Q1
18
3 261 
10
3 278 
2024 Q4
13
3 294 
8
3 157 
2024 Q3
27
3 424 
5
3 600 
2024 Q2
18
3 005 
5
3 132 
2024 Q1
11
3 209 
6
3 471 
2023 Q4
12
3 416 
5
3 659 
2023 Q3
28
3 642 
6
3 196 
2023 Q2
22
3 537 
9
3 158 
2023 Q1
15
3 439 
15
3 539 
2022 Q4
31
3 417 
7
3 478 
2022 Q3
35
3 743 
13
3 653 
2022 Q2
16
3 452 
9
3 540 
2022 Q1
22
3 498 
8
3 504 
2021 Q4
22
3 172 
15
3 375 
2021 Q3
36
3 561 
12
3 312 
2021 Q2
31
2 988 
10
3 254 
2021 Q1
24
3 087 
10
3 210 
2020 Q4
28
3 106 
4
2 828 
2020 Q3
19
3 172 
7
2 857 
2020 Q2
15
3 070 
3
2 454 
2020 Q1
15
3 310 
6
2 928 
2019 Q4
14
3 063 
6
2 540 
2019 Q3
38
2 664 
5
2 791 
2019 Q2
24
2 617 
8
2 579 
2019 Q1
16
2 688 
11
2 409 
2018 Q4
18
3 009 
10
2 512 
2018 Q3
40
2 584 
16
2 301 
2018 Q2
26
2 576 
1
1 736 
2018 Q1
16
2 646 
4
2 544 
2017 Q4
25
2 634 
6
2 950 
2017 Q3
29
2 407 
2
2 134 
2017 Q2
34
2 679 
6
2 322 
2017 Q1
30
2 510 
4
2 616 
2016 Q4
23
2 412 
3
2 589 
2016 Q3
28
2 554 
2
1 782 
2016 Q2
11
2 222 
3
3 000 
2016 Q1
13
2 879 
2
2 764 
2015 Q4
24
2 197 
5
2 447 
2015 Q3
24
2 180 
1
2 381 
2015 Q2
24
2 132 
1
1 973 
2015 Q1
11
2 246 
1
3 600 
2014 Q4
20
2 290 
9
3 525 
2014 Q3
27
2 540 
4
3 694 
2014 Q2
19
2 460 
3
2 814 
2014 Q1
32
2 224 
2
2 334 

Overview of the latest real estate transactions

The following list is an anonymized overview of the latest transactions. For more details and to find all transactions, please use the map to view transactions by plot or the transaction search page for a search by criteria.

2025-06-11
3 000 
Sale
Land
462 m2
-Jardins
Land
175 m2
-Jardins
Land
1692 m2
-Terres
Land
1613 m2
-Jardins
2025-06-10
274 
Sale
Land
274 m2
-Jardins
2025-06-10
234 000 
3 205  /m²(73 m²)
Sale
Apartments
Apartment
3 rooms
73 m2
1 outbuilding
2025-06-02
495 000 
3 367  /m²(147 m²)
Sale
Houses
House
5 rooms
147 m2
Land
778 m2
-Sols
2025-05-28
135 000 
2 755  /m²(49 m²)
Sale
Apartments
Apartment
2 rooms
49 m2
1 outbuilding
2025-05-26
141 800 
3 223  /m²(44 m²)
Sale
Apartments
Apartment
2 rooms
44 m2
2 outbuildings
2025-05-19
11 000 
Sale
1 outbuilding
2025-05-19
210 000 
1 180  /m²(178 m²)
Sale
Commercial property
178 m2
Land
694 m2
-Sols
2025-05-15
308 000 
3 143  /m²(98 m²)
Sale
Houses
House
4 rooms
98 m2
1 outbuilding
Land
685 m2
-Sols
Land
66 m2
-Sols
2025-05-06
1 
Sale
Land
26 m2
-Sols
Land
4 m2
-Sols
Land
7 m2
-Sols
Land
34 m2
-Sols
Land
1966 m2
-Sols
2025-05-02
155 000 
3 780  /m²(41 m²)
Sale
Apartments
Apartment
2 rooms
41 m2
2 outbuildings
2025-04-28
131 000 
3 359  /m²(39 m²)
Sale
Apartments
Apartment
2 rooms
39 m2
1 outbuilding
2025-04-24
150 743 
2 512  /m²(60 m²)
Sale
Apartments
Apartment
3 rooms
60 m2
1 outbuilding
2025-04-18
236 000 
3 688  /m²(64 m²)
Sale
2 outbuildings
Apartments
Apartment
3 rooms
64 m2
1 outbuilding
2025-04-17
349 500 
3 927  /m²(89 m²)
Sale
Houses
House
5 rooms
89 m2
Land
506 m2
-Sols
2025-04-14
152 000 
3 535  /m²(43 m²)
Sale
1 outbuilding
Apartments
Apartment
2 rooms
43 m2
2025-03-31
210 000 
2 838  /m²(74 m²)
Sale
Houses
House
3 rooms
74 m2
1 outbuilding
Land
449 m2
-Sols
2025-03-31
311 500 
2 091  /m²(149 m²)
Sale
Land
12 m2
-Sols
Houses
House
5 rooms
149 m2
1 outbuilding
Land
530 m2
-Sols
2025-03-31
383 
Sale
Land
762 m2
-Sols
2025-03-31
61 000 
Sale
Land
14989 m2
-Terres
Land
3546 m2
-Vignes
Land
6558 m2
-Terres
Land
7500 m2
-Vignes
Land
869 m2
-Terres
Land
4524 m2
-Terres
Land
6777 m2
-Terres
Land
14859 m2
-Terres
Land
958 m2
-Vignes
Land
7486 m2
-Terres
Land
14638 m2
-Terres
Land
2214 m2
-Taillis simples
Land
2016 m2
-Terres
Land
2231 m2
-Prés
Land
9229 m2
-Terres
Land
3589 m2
-Prés
Land
906 m2
-Terres
2294 transactions listed in the municipality

Loire-Atlantique (44)

Most expensive cities

City
name
Descending orderHouses
house
Price per m²
5 313 
4 971 
4 956 
4 688 
4 625 
4 293 
4 255 
4 196 
City
name
Descending orderApartments
apt.
Price per m²
6 488 
5 441 
5 234 
5 158 
5 066 
4 590 

Least expensive cities

City
name
Ascending orderHouses
house
Price per m²
1 058 
1 071 
1 087 
1 178 
1 178 
1 275 
City
name
Ascending orderApartments
apt.
Price per m²
34 
146 
278 
483 
714 
727