emooki
HomePrice mapTransactions
🇬🇧 English🇫🇷 Français🇩🇪 Deutsch🇪🇸 Español🇮🇹 Italiano

Real estate price map


Real estate price map in the municipality of Sainte-Luce-sur-Loire, choose a section to see transactions by parcel.

Loire-Atlantique (44)
Sainte-Luce-sur-Loire

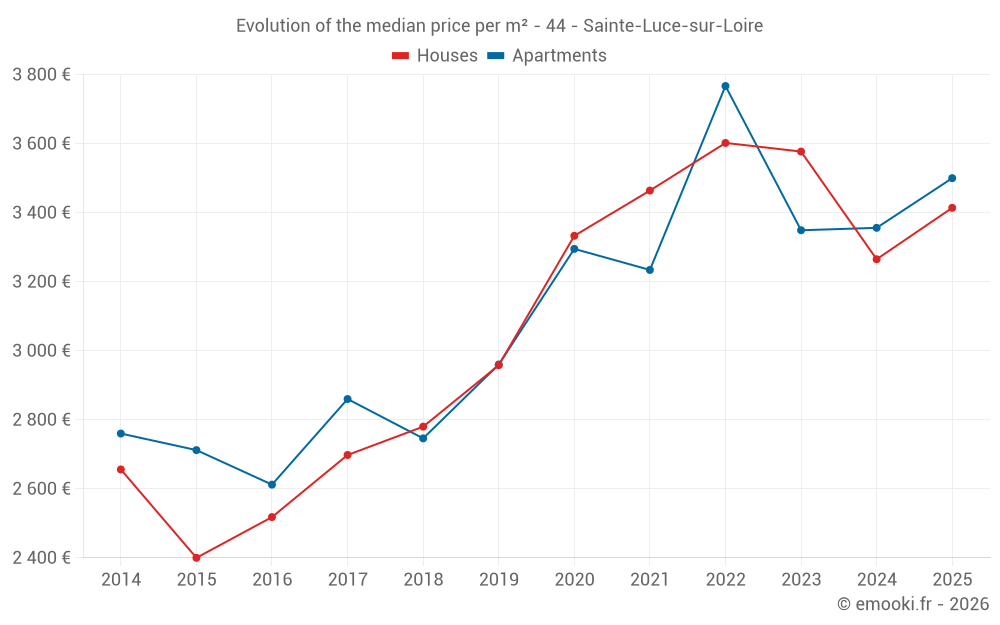
Median price of real estate
in the municipality of Sainte-Luce-sur-Loire

HousesHouses
3 414 € /m²
1-23-45-67-89-10
Reliability 9/10
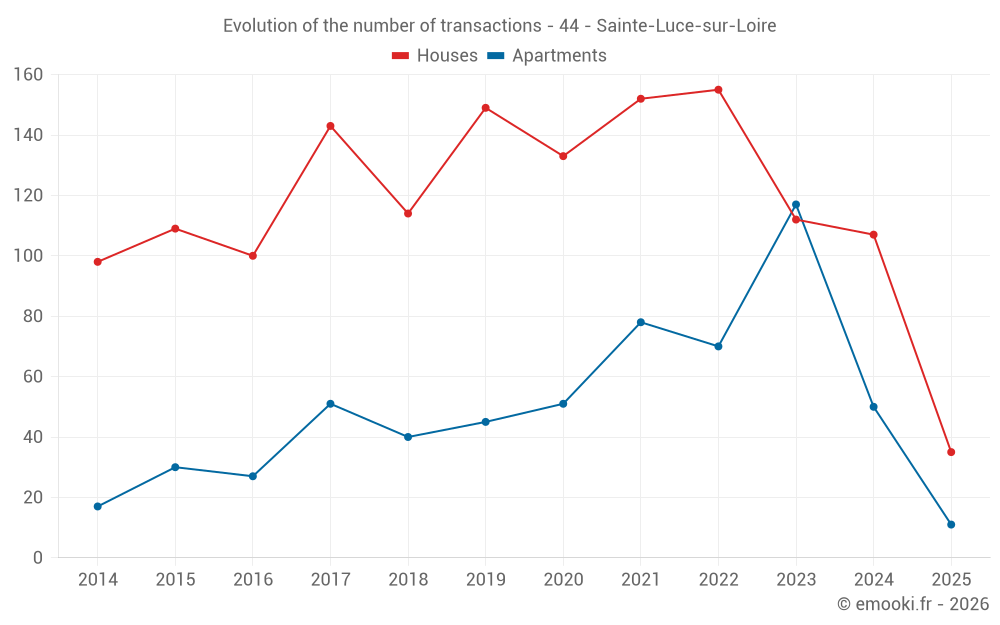
Median price on the 35 transactions of the last 6 months.
from 2 744 to
3 747 € /m²
60% of transactions from the 2nd to the 8th deciles.
ApartmentsApartments
3 537 € /m²
1-23-45-67-89-10
Reliability 8/10
Median price on the 32 transactions of the last 12 months.
from 3 062 to
3 874 € /m²
60% of transactions from the 2nd to the 8th deciles.
DwellingsDwellings
3 429 € /m²
1-23-45-67-89-10
Reliability 9/10
Median price on the 46 transactions of the last 6 months.
from 2 872 to
3 765 € /m²
60% of transactions from the 2nd to the 8th deciles.
HousesEvolution of the price per m² of houses since...
1 year
+4.6%
2 years
-4.6%
3 years
-5.2%
4 years
-1.4%
5 years
+2.4%
6 years
+15%
7 years
+23%
8 years
+27%
9 years
+36%
10 years
+42%
11 years
+29%
The price per m² of houses has decreased by 5.2% since 3 years, but it has increased by 42% in 10 years.
ApartmentsEvolution of the price per m² of apartments since...
1 year
+4.3%
2 years
+4.5%
3 years
-7.1%
4 years
+8.2%
5 years
+6.2%
6 years
+18%
7 years
+27%
8 years
+22%
9 years
+34%
10 years
+29%
11 years
+27%
The price per m² of apartments has decreased by 7.1% since 3 years, but it has increased by 34% in 9 years.

Yearly evolution

Evolution of the median price per m²

Evolution of the number of transactions

Warning, last year incomplete. Projections made based on the proportions between semesters of the previous year at the departmental/national level and by type of property.

Yearly data

Descending order
Year
Houses
house
transactions
Houses
house
Price per m²
Apartments
apt.
transactions
Apartments
apt.
Price per m²
2025
35
3 414 €
11
3 500 €
2024
107
3 265 €
50
3 356 €
2023
112
3 577 €
117
3 349 €
2022
155
3 602 €
70
3 767 €
2021
152
3 464 €
78
3 234 €
2020
133
3 333 €
51
3 295 €
2019
149
2 958 €
45
2 960 €
2018
114
2 780 €
40
2 746 €
2017
143
2 698 €
51
2 860 €
2016
100
2 518 €
27
2 612 €
2015
109
2 400 €
30
2 712 €
2014
98
2 656 €
17
2 760 €

Analysis

Structure of prices per m²

Values of price percentiles per m² over the periods used for the estimated price of each type of property.

Structure of transaction amounts

Values of transaction amounts percentiles over the periods used for the estimated price of each type of property.

Transaction amounts and prices per m² by percentile

Ascending order
Percentile
Houses
house
Price per m²
Houses
house
Transaction amount
Apartments
apt.
Price per m²
Apartments
apt.
Transaction amount
10th percentile
2 155 €
194 K€
2 875 €
133 K€
20th percentile
2 744 €
220 K€
3 062 €
145 K€
30th percentile
3 148 €
243 K€
3 246 €
156 K€
40th percentile
3 233 €
272 K€
3 396 €
166 K€
50th percentile
3 414 €
295 K€
3 537 €
178 K€
60th percentile
3 509 €
310 K€
3 708 €
183 K€
70th percentile
3 635 €
349 K€
3 797 €
215 K€
80th percentile
3 747 €
384 K€
3 874 €
234 K€
90th percentile
4 496 €
480 K€
4 020 €
247 K€

National and departmental comparison

Evolution of the median price per m² of houses

Evolution of the median price per m² of apartments

Quarterly evolution

Evolution of the median price per m²

Evolution of the number of transactions

Quarterly data

Descending order
Quarter
Houses
house
transactions
Houses
house
Price per m²
Apartments
apt.
transactions
Apartments
apt.
Price per m²
2025 Q2
11
3 414 €
3
3 208 €
2025 Q1
24
3 408 €
8
3 516 €
2024 Q4
29
3 153 €
7
3 308 €
2024 Q3
30
3 422 €
14
3 705 €
2024 Q2
28
3 158 €
15
3 288 €
2024 Q1
20
3 200 €
14
3 248 €
2023 Q4
24
3 502 €
20
3 407 €
2023 Q3
32
3 577 €
28
3 142 €
2023 Q2
31
3 781 €
55
2 602 €
2023 Q1
25
3 533 €
14
3 739 €
2022 Q4
25
3 636 €
12
3 947 €
2022 Q3
50
3 678 €
18
3 713 €
2022 Q2
40
3 528 €
20
3 788 €
2022 Q1
40
3 382 €
20
3 594 €
2021 Q4
34
3 394 €
17
3 383 €
2021 Q3
47
3 571 €
22
3 104 €
2021 Q2
35
3 444 €
17
3 286 €
2021 Q1
36
3 424 €
22
3 166 €
2020 Q4
39
3 454 €
20
3 246 €
2020 Q3
44
3 332 €
12
3 378 €
2020 Q2
25
3 367 €
12
3 238 €
2020 Q1
25
3 196 €
7
3 306 €
2019 Q4
35
3 000 €
17
3 072 €
2019 Q3
44
3 008 €
11
3 021 €
2019 Q2
40
3 016 €
10
2 924 €
2019 Q1
30
2 693 €
7
2 859 €
2018 Q4
31
2 724 €
10
2 734 €
2018 Q3
30
2 730 €
11
2 859 €
2018 Q2
20
2 793 €
11
2 889 €
2018 Q1
33
2 835 €
8
2 560 €
2017 Q4
27
2 851 €
11
3 265 €
2017 Q3
33
2 710 €
12
3 080 €
2017 Q2
45
2 632 €
15
2 714 €
2017 Q1
38
2 692 €
13
2 623 €
2016 Q4
35
2 637 €
5
2 609 €
2016 Q3
28
2 436 €
6
2 806 €
2016 Q2
14
2 464 €
10
2 693 €
2016 Q1
23
2 609 €
6
2 228 €
2015 Q4
28
2 582 €
11
3 190 €
2015 Q3
42
2 392 €
6
2 753 €
2015 Q2
24
2 406 €
9
2 663 €
2015 Q1
15
2 300 €
4
2 748 €
2014 Q4
23
2 560 €
3
2 295 €
2014 Q3
23
2 596 €
9
2 760 €
2014 Q2
33
2 650 €
3
2 917 €
2014 Q1
19
2 823 €
2
2 958 €

Overview of the latest real estate transactions

The following list is an anonymized overview of the latest transactions. For more details and to find all transactions, please use the map to view transactions by plot or the transaction search page for a search by criteria.

2025-06-13
285 000 €
2 111 € /m²(135 m²)
Sale
Houses
House
5 rooms
135 m2
Land
249 m2
-Sols
2025-06-11
15 000 €
192 € /m²(78 m²)
Sale
Houses
House
4 rooms
78 m2
2 outbuildings
Land
689 m2
-Sols
2025-06-10
260 000 €
3 250 € /m²(80 m²)
Sale
Houses
House
4 rooms
80 m2
Land
371 m2
-Sols
2025-06-10
345 000 €
3 670 € /m²(94 m²)
Sale
Houses
House
5 rooms
94 m2
1 outbuilding
Land
516 m2
-Sols
2025-06-06
1 €
Sale
Land
1 m2
-Terres
2025-06-03
205 500 €
3 262 € /m²(63 m²)
Sale
Houses
House
4 rooms
63 m2
1 outbuilding
Land
552 m2
-Sols
2025-05-30
800 000 €
1 171 € /m²(683 m²)
33 333 € /m²(24 m²)
Sale
Apartments
Apartment
2 rooms
24 m2
Commercial property
659 m2
Land
2853 m2
-Sols
2025-05-26
5 524 €
Sale
Land
9437 m2
-Prés
Land
8975 m2
-Prés
2025-05-26
500 €
Sale
Land
50 m2
-Prés
Land
438 m2
-Prés
2025-05-21
650 000 €
4 114 € /m²(158 m²)
Sale
Commercial property
158 m2
Land
2742 m2
-Sols
Land
73 m2
-Prés
2025-05-14
310 000 €
5 849 € /m²(53 m²)
Sale
Houses
House
2 rooms
53 m2
2 outbuildings
Land
257 m2
-Sols
2025-05-14
40 340 €
Sale
Land
602 m2
-Terres
Land
3432 m2
-Terres
2025-05-14
101 400 €
746 € /m²(136 m²)
Sale
Houses
House
5 rooms
136 m2
2 outbuildings
Land
476 m2
-Jardins
Land
223 m2
-Sols
2025-05-12
225 000 €
3 750 € /m²(60 m²)
Sale
Houses
House
3 rooms
60 m2
Land
386 m2
-Sols
2025-05-07
180 000 €
2 813 € /m²(64 m²)
Sale
Apartments
Apartment
2 rooms
64 m2
1 outbuilding
2025-05-05
162 000 €
3 767 € /m²(43 m²)
Sale
Apartments
Apartment
2 rooms
43 m2
2 outbuildings
2025-04-30
439 970 €
2 895 € /m²(152 m²)
5 500 € /m²(80 m²)
Sale
Houses
House
4 rooms
80 m2
Commercial property
72 m2
2 outbuildings
Land
543 m2
-Sols
2025-04-30
247 000 €
3 208 € /m²(77 m²)
Sale
Apartments
Apartment
4 rooms
77 m2
2 outbuildings
2025-04-18
566 700 €
3 414 € /m²(166 m²)
Sale
Houses
House
5 rooms
166 m2
1 outbuilding
Land
721 m2
-Sols
2025-04-11
158 500 €
3 522 € /m²(45 m²)
Sale
Houses
House
2 rooms
45 m2
Land
153 m2
-Sols
3152 transactions listed in the municipality

Loire-Atlantique (44)

Most expensive cities

City
name
Descending orderHouses
house
Price per m²
6 276 €
5 313 €
4 971 €
4 956 €
4 688 €
4 625 €
4 293 €
4 255 €
4 213 €
4 196 €
City
name
Descending orderApartments
apt.
Price per m²
6 500 €
6 488 €
5 441 €
5 234 €
5 158 €
5 066 €
5 056 €
5 021 €
4 590 €
4 259 €

Least expensive cities

City
name
Ascending orderHouses
house
Price per m²
816 €
1 058 €
1 071 €
1 087 €
1 164 €
1 174 €
1 178 €
1 178 €
1 275 €
City
name
Ascending orderApartments
apt.
Price per m²
34 €
146 €
278 €
388 €
483 €
564 €
714 €
727 €