emooki
HomePrice mapTransactions
🇬🇧 English🇫🇷 Français🇩🇪 Deutsch🇪🇸 Español🇮🇹 Italiano

Real estate price map


Real estate price map in the municipality of Le Cellier, choose a section to see transactions by parcel.

Loire-Atlantique (44)

Le Cellier - Real estate price m²

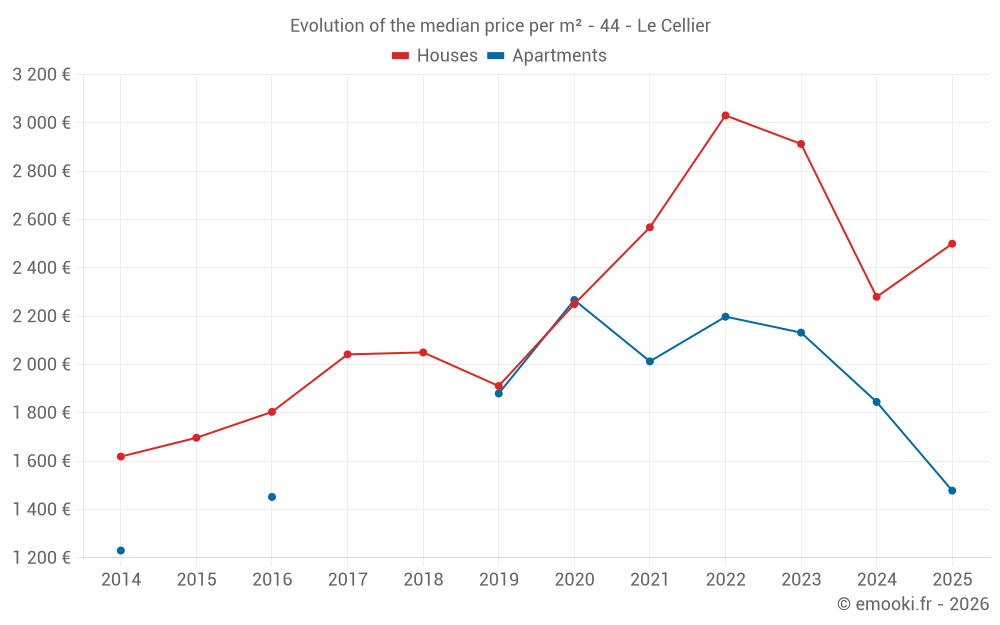
Median price of real estate
in the municipality of Le Cellier

HousesHouses
2 389  /m²
1-23-45-67-89-10
Reliability 8/10
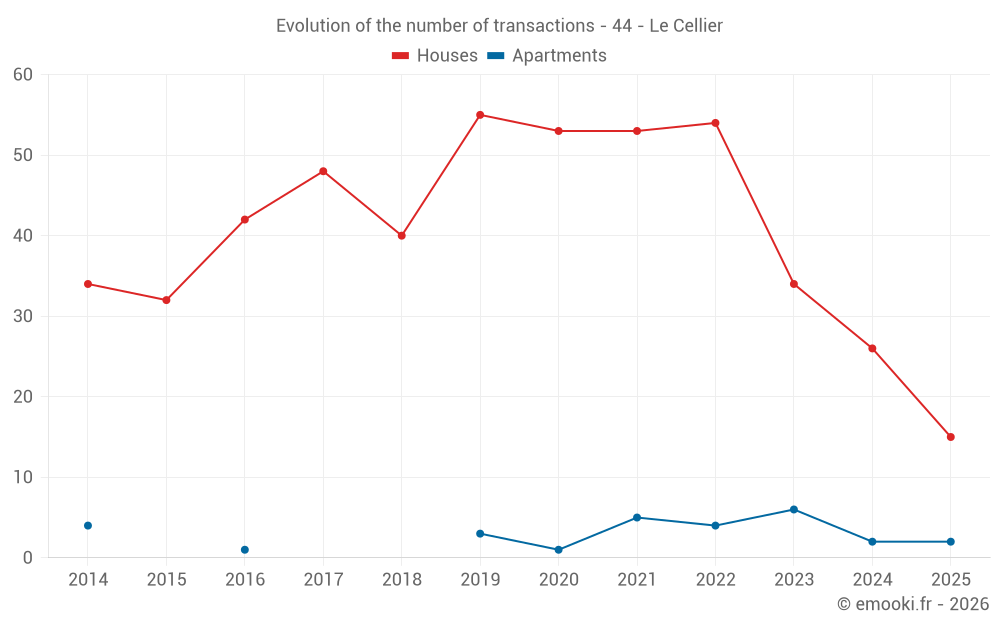
Median price on the 29 transactions of the last 12 months.
from 1 629 to
3 222  /m²
60% of transactions from the 2nd to the 8th deciles.
ApartmentsApartments
1 836  /m²
1-23-45-67-89-10
Reliability 6/10
Median price on the 12 transactions of the last 36 months.
from 1 585 to
2 397  /m²
60% of transactions from the 2nd to the 8th deciles.
DwellingsDwellings
2 374  /m²
1-23-45-67-89-10
Reliability 8/10
Median price on the 33 transactions of the last 12 months.
from 1 464 to
3 060  /m²
60% of transactions from the 2nd to the 8th deciles.
HousesEvolution of the price per m² of houses since...
1 year
+10%
2 years
-14%
3 years
-18%
4 years
-2.6%
5 years
+11%
6 years
+31%
7 years
+22%
8 years
+22%
9 years
+39%
10 years
+47%
11 years
+54%
The price per m² of houses has decreased by 18% since 3 years, but it has increased by 54% in 11 years.

Yearly evolution

Evolution of the median price per m²

Evolution of the median price per m² - 44 - Le Cellier

Evolution of the number of transactions

Warning, last year incomplete. Projections made based on the proportions between semesters of the previous year at the departmental/national level and by type of property.

Evolution of the number of transactions - 44 - Le Cellier

Yearly data

Descending order
Year
Houses
house
transactions
Houses
house
Price per m²
Apartments
apt.
transactions
Apartments
apt.
Price per m²
2025
15
2 500 
2
1 478 
2024
26
2 280 
2
1 845 
2023
34
2 913 
6
2 132 
2022
54
3 031 
4
2 198 
2021
53
2 568 
5
2 013 
2020
53
2 250 
1
2 267 
2019
55
1 911 
3
1 880 
2018
40
2 050 
0
--- 
2017
48
2 042 
0
--- 
2016
42
1 804 
1
1 452 
2015
32
1 697 
0
--- 
2014
34
1 619 
4
1 230 

Analysis

Structure of prices per m²

Values of price percentiles per m² over the periods used for the estimated price of each type of property.

Structure of transaction amounts

Values of transaction amounts percentiles over the periods used for the estimated price of each type of property.

Transaction amounts and prices per m² by percentile

Ascending order
Percentile
Houses
house
Price per m²
Houses
house
Transaction amount
Apartments
apt.
Price per m²
Apartments
apt.
Transaction amount
10th percentile
1 078 
105 K
1 420 
132 K
20th percentile
1 629 
166 K
1 585 
146 K
30th percentile
2 078 
210 K
1 733 
152 K
40th percentile
2 235 
229 K
1 757 
157 K
50th percentile
2 389 
268 K
1 836 
163 K
60th percentile
2 610 
315 K
1 994 
168 K
70th percentile
2 906 
343 K
2 265 
177 K
80th percentile
3 222 
374 K
2 397 
198 K
90th percentile
3 747 
426 K
2 664 
241 K

National and departmental comparison

Evolution of the median price per m² of houses

Evolution of the median price per m² of apartments

Quarterly evolution

Evolution of the median price per m²

Evolution of the number of transactions

Quarterly data

Descending order
Quarter
Houses
house
transactions
Houses
house
Price per m²
Apartments
apt.
transactions
Apartments
apt.
Price per m²
2025 Q2
6
2 195 
0
--- 
2025 Q1
9
2 615 
2
1 478 
2024 Q4
9
1 659 
1
2 732 
2024 Q3
5
2 978 
1
958 
2024 Q2
7
1 812 
0
--- 
2024 Q1
5
3 027 
0
--- 
2023 Q4
7
3 222 
1
2 407 
2023 Q3
10
1 936 
1
2 357 
2023 Q2
7
3 050 
1
2 693 
2023 Q1
10
2 758 
3
1 763 
2022 Q4
11
3 400 
2
1 888 
2022 Q3
20
2 993 
0
--- 
2022 Q2
12
3 372 
2
2 360 
2022 Q1
11
2 537 
0
--- 
2021 Q4
12
2 540 
1
1 209 
2021 Q3
24
2 876 
1
3 036 
2021 Q2
11
2 696 
1
2 075 
2021 Q1
6
2 164 
2
2 006 
2020 Q4
14
2 468 
0
--- 
2020 Q3
17
2 769 
1
2 267 
2020 Q2
7
1 830 
0
--- 
2020 Q1
15
2 148 
0
--- 
2019 Q4
16
1 858 
1
2 085 
2019 Q3
11
1 850 
2
1 729 
2019 Q2
16
1 956 
0
--- 
2019 Q1
12
1 838 
0
--- 
2018 Q4
15
2 220 
0
--- 
2018 Q3
15
1 598 
0
--- 
2018 Q2
6
2 229 
0
--- 
2018 Q1
4
2 064 
0
--- 
2017 Q4
10
1 718 
0
--- 
2017 Q3
16
2 248 
0
--- 
2017 Q2
6
2 042 
0
--- 
2017 Q1
16
1 840 
0
--- 
2016 Q4
9
1 462 
1
1 452 
2016 Q3
15
1 808 
0
--- 
2016 Q2
6
1 678 
0
--- 
2016 Q1
12
2 156 
0
--- 
2015 Q4
15
1 962 
0
--- 
2015 Q3
8
1 664 
0
--- 
2015 Q2
7
1 250 
0
--- 
2015 Q1
2
2 090 
0
--- 
2014 Q4
10
1 772 
3
1 638 
2014 Q3
7
1 522 
0
--- 
2014 Q2
7
1 955 
0
--- 
2014 Q1
10
1 350 
1
821 

Overview of the latest real estate transactions

The following list is an anonymized overview of the latest transactions. For more details and to find all transactions, please use the map to view transactions by plot or the transaction search page for a search by criteria.

2025-06-13
245 000 
2 168  /m²(113 m²)
Sale
Houses
House
7 rooms
113 m2
1 outbuilding
Land
682 m2
-Sols
2025-06-04
5 200 
Sale
Land
1630 m2
-Terres
Land
13940 m2
-Terres
2025-05-30
358 500 
4 780  /m²(75 m²)
Sale
Land
790 m2
-Sols
Land
791 m2
-Sols
Land
1500 m2
-Jardins
Houses
House
3 rooms
75 m2
Land
1402 m2
-Sols
Land
11820 m2
-Terres
Land
13300 m2
-Terres
Land
15320 m2
-Terres
Land
3800 m2
-Terres
Land
11700 m2
-Terres
Land
19950 m2
-Terres
Land
4050 m2
-Terres
Land
880 m2
-Jardins
Land
2960 m2
-Jardins
Land
4160 m2
-Terres
Land
20550 m2
-Taillis simples
Land
41040 m2
-Terres
Land
9300 m2
-Terres
Land
31800 m2
-Prés
Land
12720 m2
-Terres
Land
10450 m2
-Terres
Land
13650 m2
-Terres
Land
12250 m2
-Terres
Land
6120 m2
-Prés
Land
7460 m2
-Terres
Land
8500 m2
-Terres
Land
10620 m2
-Terres
Land
11400 m2
-Terres
Land
9000 m2
-Terres
Land
7370 m2
-Terres
Land
16720 m2
-Terres
Land
16720 m2
-Terres
Land
8667 m2
-Terres
Land
11920 m2
-Terres
Land
13120 m2
-Terres
Land
12600 m2
-Terres
Land
1062 m2
-Prés
Land
2880 m2
-Prés
Land
14900 m2
-Terres
Land
12850 m2
-Terres
Land
12560 m2
-Terres
Land
24850 m2
-Terres
Land
122160 m2
-Terres
2025-05-30
145 
Sale
Land
16720 m2
-Terres
2025-05-14
200 000 
3 333  /m²(60 m²)
Sale
Commercial property
60 m2
Land
1938 m2
-Sols
2025-05-12
322 000 
2 118  /m²(152 m²)
Sale
Houses
House
5 rooms
152 m2
Land
182 m2
-Sols
2025-04-30
210 000 
2 877  /m²(73 m²)
Sale
Houses
House
4 rooms
73 m2
Land
550 m2
-Sols
Land
2010 m2
-Jardins
Land
1320 m2
-Terres
2025-04-25
400 000 
2 222  /m²(180 m²)
Sale
Land
1750 m2
-Terrains à bâtir
Houses
House
5 rooms
180 m2
1 outbuilding
Land
1000 m2
-Sols
Land
2376 m2
-Terrains d'agrément
2025-04-24
32 500 
130  /m²(250 m²)
Sale
Land
10550 m2
-Terres
Commercial property
250 m2
Land
12829 m2
-Terres
Land
8165 m2
-Terres
Land
19150 m2
-Terres
Land
14320 m2
-Terres
2025-04-23
2 000 
Exchange
Land
15 m2
-Sols
Land
66 m2
-Sols
Land
29 m2
-Sols
2025-04-23
30 000 
Sale
2 outbuildings
Land
38 m2
-Sols
2025-04-18
195 000 
1 585  /m²(123 m²)
Sale
Houses
House
5 rooms
123 m2
Land
775 m2
-Sols
Land
100 m2
-Sols
2025-04-18
150 
Sale
Land
150 m2
-Terres
2025-03-31
2 274 
Sale
Land
4330 m2
-Prés
Land
3250 m2
-Prés
2025-03-27
420 000 
3 652  /m²(115 m²)
Sale
Houses
House
4 rooms
115 m2
Land
1000 m2
-Sols
2025-03-20
300 000 
Sale
Land
400 m2
-Sols
Land
8010 m2
-Terres
2025-03-19
620 000 
2 925  /m²(212 m²)
Sale
Land
24 m2
-Sols
Houses
House
6 rooms
212 m2
Land
1913 m2
-Sols
Land
405 m2
-Terrains à bâtir
Land
49 m2
-Terrains à bâtir
Land
38 m2
-Terrains à bâtir
2025-03-19
285 000 
2 615  /m²(109 m²)
Sale
Houses
House
5 rooms
109 m2
Land
450 m2
-Sols
2025-03-18
50 
Sale
Land
24 m2
-Sols
Land
17 m2
-Sols
Land
20 m2
-Sols
2025-03-14
254 000 
2 374  /m²(107 m²)
Sale
Houses
House
4 rooms
107 m2
1 outbuilding
Land
500 m2
-Sols
Land
1362 m2
-Terrains d'agrément
1071 transactions listed in the municipality

Loire-Atlantique (44)

Most expensive cities

City
name
Descending orderHouses
house
Price per m²
5 313 
4 971 
4 956 
4 688 
4 625 
4 293 
4 255 
4 196 
City
name
Descending orderApartments
apt.
Price per m²
6 488 
5 441 
5 234 
5 158 
5 066 
4 590 

Least expensive cities

City
name
Ascending orderHouses
house
Price per m²
1 058 
1 071 
1 087 
1 178 
1 178 
1 275 
City
name
Ascending orderApartments
apt.
Price per m²
34 
146 
278 
483 
714 
727