emooki
HomePrice mapTransactions
🇬🇧 English🇫🇷 Français🇩🇪 Deutsch🇪🇸 Español🇮🇹 Italiano

Real estate price map


Real estate price map in the municipality of Pornic, choose a section to see transactions by parcel.

Loire-Atlantique (44)

Pornic - Real estate price m²

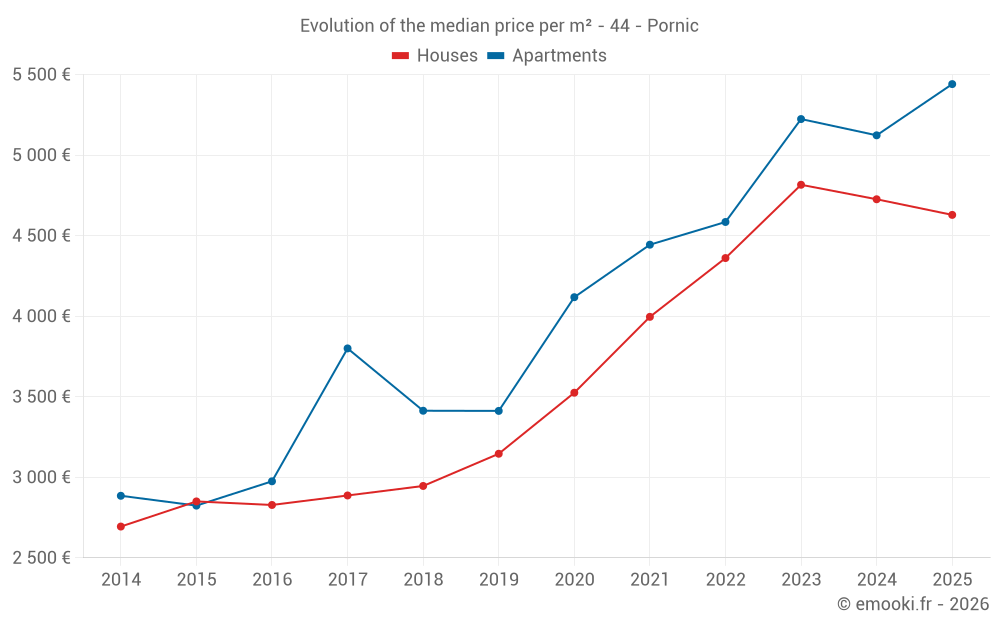
Median price of real estate
in the municipality of Pornic

HousesHouses
4 688  /m²
1-23-45-67-89-10
Reliability 10/10
Median price on the 45 transactions of the last 3 months.
from 3 554 to
6 761  /m²
60% of transactions from the 2nd to the 8th deciles.
ApartmentsApartments
5 441  /m²
1-23-45-67-89-10
Reliability 9/10
Median price on the 35 transactions of the last 6 months.
from 4 581 to
6 426  /m²
60% of transactions from the 2nd to the 8th deciles.
DwellingsDwellings
4 889  /m²
1-23-45-67-89-10
Reliability 10/10
Median price on the 63 transactions of the last 3 months.
from 3 840 to
6 503  /m²
60% of transactions from the 2nd to the 8th deciles.
HousesEvolution of the price per m² of houses since...
1 year
-2.1%
2 years
-3.9%
3 years
+6.1%
4 years
+16%
5 years
+31%
6 years
+47%
7 years
+57%
8 years
+60%
9 years
+64%
10 years
+62%
11 years
+72%
The price per m² of houses has decreased by 3.9% since 2 years, but it has increased by 72% in 11 years.
ApartmentsEvolution of the price per m² of apartments since...
1 year
+6.2%
2 years
+4.2%
3 years
+19%
4 years
+22%
5 years
+32%
6 years
+59%
7 years
+59%
8 years
+43%
9 years
+83%
10 years
+93%
11 years
+89%

Yearly evolution

Evolution of the median price per m²

Evolution of the median price per m² - 44 - Pornic

Evolution of the number of transactions

Warning, last year incomplete. Projections made based on the proportions between semesters of the previous year at the departmental/national level and by type of property.

Evolution of the number of transactions - 44 - Pornic

Yearly data

Descending order
Year
Houses
house
transactions
Houses
house
Price per m²
Apartments
apt.
transactions
Apartments
apt.
Price per m²
2025
116
4 629 
35
5 441 
2024
214
4 726 
88
5 123 
2023
236
4 816 
64
5 224 
2022
320
4 361 
75
4 585 
2021
321
3 996 
75
4 444 
2020
291
3 525 
71
4 118 
2019
342
3 146 
74
3 412 
2018
308
2 946 
69
3 413 
2017
300
2 887 
75
3 800 
2016
287
2 828 
48
2 975 
2015
231
2 850 
40
2 824 
2014
240
2 694 
49
2 885 

Analysis

Structure of prices per m²

Values of price percentiles per m² over the periods used for the estimated price of each type of property.

Structure of transaction amounts

Values of transaction amounts percentiles over the periods used for the estimated price of each type of property.

Transaction amounts and prices per m² by percentile

Ascending order
Percentile
Houses
house
Price per m²
Houses
house
Transaction amount
Apartments
apt.
Price per m²
Apartments
apt.
Transaction amount
10th percentile
2 881 
226 K
3 958 
125 K
20th percentile
3 554 
270 K
4 581 
159 K
30th percentile
4 045 
327 K
4 858 
185 K
40th percentile
4 340 
372 K
5 052 
188 K
50th percentile
4 688 
415 K
5 441 
198 K
60th percentile
5 632 
456 K
5 704 
220 K
70th percentile
5 933 
551 K
5 825 
252 K
80th percentile
6 761 
722 K
6 426 
290 K
90th percentile
7 805 
912 K
7 787 
479 K

National and departmental comparison

Evolution of the median price per m² of houses

Evolution of the median price per m² of apartments

Quarterly evolution

Evolution of the median price per m²

Evolution of the number of transactions

Quarterly data

Descending order
Quarter
Houses
house
transactions
Houses
house
Price per m²
Apartments
apt.
transactions
Apartments
apt.
Price per m²
2025 Q2
45
4 688 
18
5 293 
2025 Q1
71
4 591 
17
5 577 
2024 Q4
65
4 504 
24
5 165 
2024 Q3
53
4 868 
31
5 227 
2024 Q2
52
4 756 
13
5 024 
2024 Q1
44
4 568 
20
5 064 
2023 Q4
47
4 947 
15
4 913 
2023 Q3
67
4 836 
13
5 320 
2023 Q2
62
4 812 
20
5 375 
2023 Q1
60
4 712 
16
4 948 
2022 Q4
72
4 962 
13
4 718 
2022 Q3
84
4 680 
19
4 769 
2022 Q2
84
4 114 
21
4 255 
2022 Q1
80
4 088 
22
4 383 
2021 Q4
85
4 174 
21
5 154 
2021 Q3
99
3 969 
17
3 444 
2021 Q2
77
3 750 
21
4 412 
2021 Q1
60
3 599 
16
4 562 
2020 Q4
103
3 504 
18
4 114 
2020 Q3
61
3 781 
18
4 092 
2020 Q2
57
3 525 
16
4 170 
2020 Q1
70
3 314 
19
3 984 
2019 Q4
101
3 195 
22
3 417 
2019 Q3
99
3 308 
17
3 542 
2019 Q2
80
3 047 
18
3 412 
2019 Q1
62
2 966 
17
3 338 
2018 Q4
84
3 052 
22
3 676 
2018 Q3
82
3 045 
13
3 778 
2018 Q2
70
2 968 
16
3 250 
2018 Q1
72
2 858 
18
2 918 
2017 Q4
83
2 978 
19
3 814 
2017 Q3
75
2 857 
24
4 126 
2017 Q2
76
2 859 
18
3 670 
2017 Q1
66
2 856 
14
3 450 
2016 Q4
78
2 989 
12
2 528 
2016 Q3
74
3 033 
9
2 917 
2016 Q2
83
2 775 
16
3 633 
2016 Q1
52
2 706 
11
2 931 
2015 Q4
65
3 000 
13
2 976 
2015 Q3
68
2 840 
12
2 805 
2015 Q2
64
2 757 
9
2 791 
2015 Q1
34
2 831 
6
2 600 
2014 Q4
80
2 628 
21
2 885 
2014 Q3
68
2 736 
7
2 087 
2014 Q2
46
2 804 
10
3 470 
2014 Q1
46
2 417 
11
2 826 

Overview of the latest real estate transactions

The following list is an anonymized overview of the latest transactions. For more details and to find all transactions, please use the map to view transactions by plot or the transaction search page for a search by criteria.

2025-06-30
255 000 
5 795  /m²(44 m²)
Sale
Land
81 m2
-Sols
Apartments
Apartment
2 rooms
44 m2
1 outbuilding
2025-06-30
360 000 
4 557  /m²(79 m²)
Sale
Houses
House
3 rooms
79 m2
Land
716 m2
-Sols
2025-06-27
270 000 
3 068  /m²(88 m²)
Sale
Houses
House
4 rooms
88 m2
Land
249 m2
-Sols
2025-06-27
118 000 
5 364  /m²(22 m²)
Sale
Apartments
Apartment
1 room
22 m2
2025-06-27
2 000 
Sale
Land
823 m2
-Terres
Land
1647 m2
-Terres
Land
2054 m2
-Terres
Land
1026 m2
-Terres
2025-06-26
162 000 
5 786  /m²(28 m²)
Sale
Apartments
Apartment
2 rooms
28 m2
1 outbuilding
2025-06-26
160 000 
6 154  /m²(26 m²)
Sale
Apartments
Apartment
2 rooms
26 m2
1 outbuilding
2025-06-26
22 000 
Sale
1 outbuilding
2025-06-26
556 000 
5 398  /m²(103 m²)
Sale
Houses
House
6 rooms
103 m2
2 outbuildings
Land
337 m2
-Sols
2025-06-25
278 500 
3 396  /m²(82 m²)
Sale
Houses
House
3 rooms
82 m2
Land
475 m2
-Sols
2025-06-25
450 000 
4 688  /m²(96 m²)
Sale
Houses
House
5 rooms
96 m2
1 outbuilding
Land
450 m2
-Sols
2025-06-24
712 350 
4 879  /m²(146 m²)
Sale
Houses
House
6 rooms
146 m2
Land
450 m2
-Sols
2025-06-24
468 184 
4 036  /m²(116 m²)
Sale
Houses
House
4 rooms
116 m2
1 outbuilding
Land
950 m2
-Sols
2025-06-24
220 000 
4 889  /m²(45 m²)
Sale
Apartments
Apartment
2 rooms
45 m2
2 outbuildings
2025-06-24
180 000 
4 286  /m²(42 m²)
Sale
Commercial property
42 m2
Land
60 m2
-Sols
2025-06-23
300 000 
2 703  /m²(111 m²)
Sale
Commercial property
111 m2
Land
215 m2
-Terrains d'agrément
2025-06-23
345 000 
4 423  /m²(78 m²)
Sale
Houses
House
4 rooms
78 m2
2 outbuildings
Land
135 m2
-Sols
2025-06-23
600 000 
Sale
Land
333 m2
-Terrains à bâtir
Land
382 m2
-Terrains à bâtir
Land
321 m2
-Terrains à bâtir
Land
358 m2
-Terrains à bâtir
Land
471 m2
-Terrains à bâtir
Land
326 m2
-Terrains à bâtir
Land
362 m2
-Terrains à bâtir
Land
387 m2
-Terrains à bâtir
Land
1003 m2
-Sols
Land
418 m2
-Terrains à bâtir
Land
800 m2
-Terrains à bâtir
Land
33 m2
-Sols
2025-06-23
500 000 
5 618  /m²(89 m²)
Sale
Houses
House
3 rooms
89 m2
1 outbuilding
Land
514 m2
-Sols
2025-06-23
415 000 
4 278  /m²(97 m²)
Sale
Houses
House
4 rooms
97 m2
Land
387 m2
-Sols
7752 transactions listed in the municipality

Loire-Atlantique (44)

Most expensive cities

City
name
Descending orderHouses
house
Price per m²
5 313 
4 971 
4 956 
4 688 
4 625 
4 293 
4 255 
4 196 
City
name
Descending orderApartments
apt.
Price per m²
6 488 
5 441 
5 234 
5 158 
5 066 
4 590 

Least expensive cities

City
name
Ascending orderHouses
house
Price per m²
1 058 
1 071 
1 087 
1 178 
1 178 
1 275 
City
name
Ascending orderApartments
apt.
Price per m²
34 
146 
278 
483 
714 
727