emooki
HomePrice mapTransactions
🇬🇧 English🇫🇷 Français🇩🇪 Deutsch🇪🇸 Español🇮🇹 Italiano

Real estate price map


Real estate price map in the municipality of Saint-Julien-de-Vouvantes, choose a section to see transactions by parcel.

Loire-Atlantique (44)

Saint-Julien-de-Vouvantes - Real estate price m²

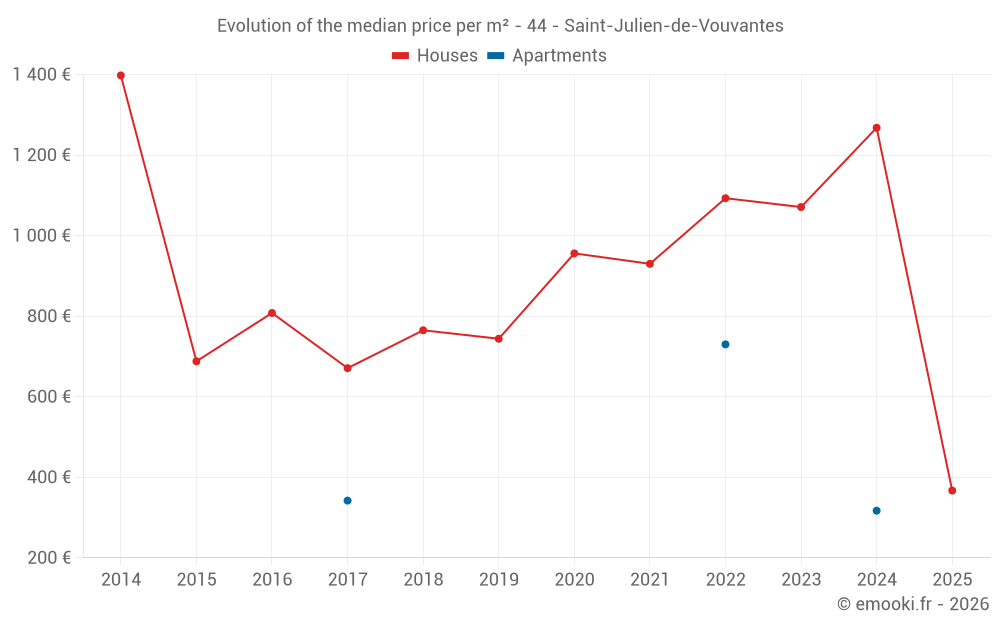
Median price of real estate
in the municipality of Saint-Julien-de-Vouvantes

HousesHouses
1 164  /m²
1-23-45-67-89-10
Reliability 7/10
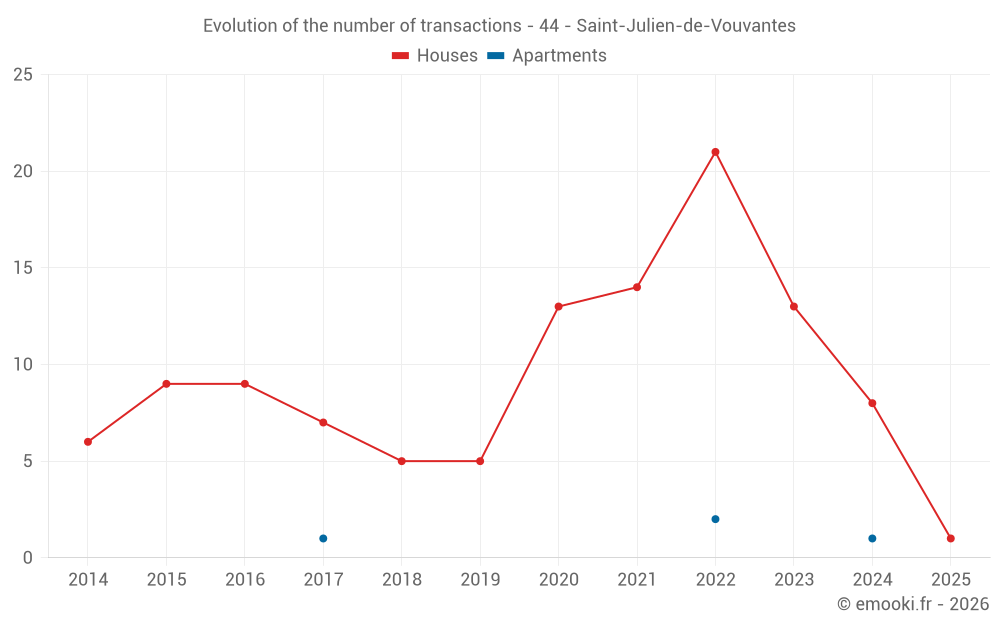
Median price on the 16 transactions of the last 24 months.
from 1 000 to
1 750  /m²
60% of transactions from the 2nd to the 8th deciles.
ApartmentsApartments
531  /m²
1-23-45-67-89-10
Reliability 2/10
Median price on the 4 transactions of the last 96 months.
DwellingsDwellings
1 115  /m²
1-23-45-67-89-10
Reliability 7/10
Median price on the 17 transactions of the last 24 months.
from 811 to
1 722  /m²
60% of transactions from the 2nd to the 8th deciles.

Yearly evolution

Evolution of the median price per m²

Evolution of the median price per m² - 44 - Saint-Julien-de-Vouvantes

Evolution of the number of transactions

Warning, last year incomplete. Projections made based on the proportions between semesters of the previous year at the departmental/national level and by type of property.

Evolution of the number of transactions - 44 - Saint-Julien-de-Vouvantes

Yearly data

Descending order
Year
Houses
house
transactions
Houses
house
Price per m²
Apartments
apt.
transactions
Apartments
apt.
Price per m²
2025
1
367 
0
--- 
2024
8
1 268 
1
317 
2023
13
1 071 
0
--- 
2022
21
1 093 
2
730 
2021
14
930 
0
--- 
2020
13
956 
0
--- 
2019
5
744 
0
--- 
2018
5
765 
0
--- 
2017
7
671 
1
342 
2016
9
808 
0
--- 
2015
9
688 
0
--- 
2014
6
1 398 
0
--- 

Analysis

Structure of prices per m²

Values of price percentiles per m² over the periods used for the estimated price of each type of property.

Structure of transaction amounts

Values of transaction amounts percentiles over the periods used for the estimated price of each type of property.

Transaction amounts and prices per m² by percentile

Ascending order
Percentile
Houses
house
Price per m²
Houses
house
Transaction amount
Apartments
apt.
Price per m²
Apartments
apt.
Transaction amount
10th percentile
642 
55 000 
324 
36 400 
20th percentile
1 000 
70 000 
332 
47 800 
30th percentile
1 040 
91 000 
340 
59 200 
40th percentile
1 107 
100 K
418 
67 100 
50th percentile
1 164 
105 K
531 
73 250 
60th percentile
1 258 
120 K
644 
79 400 
70th percentile
1 444 
123 K
722 
85 950 
80th percentile
1 750 
138 K
728 
93 300 
90th percentile
1 936 
164 K
734 
101 K

National and departmental comparison

Evolution of the median price per m² of houses

Evolution of the median price per m² of apartments

Quarterly evolution

Evolution of the median price per m²

Evolution of the number of transactions

Quarterly data

Descending order
Quarter
Houses
house
transactions
Houses
house
Price per m²
Apartments
apt.
transactions
Apartments
apt.
Price per m²
2025 Q2
1
367 
0
--- 
2024 Q4
2
1 346 
0
--- 
2024 Q3
5
1 277 
1
317 
2024 Q1
1
1 258 
0
--- 
2023 Q4
3
1 071 
0
--- 
2023 Q3
4
1 164 
0
--- 
2023 Q2
2
1 291 
0
--- 
2023 Q1
4
536 
0
--- 
2022 Q4
8
1 008 
1
720 
2022 Q3
2
1 416 
0
--- 
2022 Q2
5
956 
0
--- 
2022 Q1
6
976 
1
740 
2021 Q4
5
1 056 
0
--- 
2021 Q3
4
940 
0
--- 
2021 Q2
4
864 
0
--- 
2021 Q1
1
500 
0
--- 
2020 Q4
4
889 
0
--- 
2020 Q3
3
545 
0
--- 
2020 Q2
4
978 
0
--- 
2020 Q1
2
1 276 
0
--- 
2019 Q4
1
744 
0
--- 
2019 Q3
1
799 
0
--- 
2019 Q2
2
782 
0
--- 
2019 Q1
1
500 
0
--- 
2018 Q4
2
500 
0
--- 
2018 Q3
1
1 507 
0
--- 
2018 Q2
1
374 
0
--- 
2018 Q1
1
1 055 
0
--- 
2017 Q4
2
497 
1
342 
2017 Q3
1
677 
0
--- 
2017 Q2
3
545 
0
--- 
2017 Q1
1
1 000 
0
--- 
2016 Q4
3
545 
0
--- 
2016 Q3
2
399 
0
--- 
2016 Q2
2
858 
0
--- 
2016 Q1
2
1 002 
0
--- 
2015 Q4
4
1 273 
0
--- 
2015 Q3
2
676 
0
--- 
2015 Q1
3
660 
0
--- 
2014 Q3
3
1 333 
0
--- 
2014 Q2
1
2 091 
0
--- 
2014 Q1
2
783 
0
--- 

Overview of the latest real estate transactions

The following list is an anonymized overview of the latest transactions. For more details and to find all transactions, please use the map to view transactions by plot or the transaction search page for a search by criteria.

2025-06-05
23 794 
Sale
Commercial property
Land
161 m2
-Terres
2025-05-22
55 000 
367  /m²(150 m²)
Sale
Houses
House
5 rooms
150 m2
Land
357 m2
-Sols
2024-12-27
390 000 
55  /m²(7040 m²)
Sale
Commercial property
7040 m2
Commercial property
Land
8875 m2
-Sols
2024-12-13
162 000 
1 929  /m²(84 m²)
Sale
Houses
House
5 rooms
84 m2
2 outbuildings
Land
2695 m2
-Sols
Land
3285 m2
-Terres
Land
7481 m2
-Terres
2024-12-13
8 000 
Sale
Land
376 m2
-Sols
Land
538 m2
-Sols
2024-10-23
55 000 
764  /m²(72 m²)
Sale
Houses
House
2 rooms
72 m2
Land
67 m2
-Sols
Land
3 m2
-Sols
2024-09-19
120 000 
1 277  /m²(94 m²)
Sale
Houses
House
4 rooms
94 m2
Land
125 m2
-Sols
Land
874 m2
-Jardins
Land
140 m2
-Sols
2024-09-17
34 976 
Sale
Land
24700 m2
-Terres
Land
74490 m2
-Terres
Land
740 m2
-Terres
2024-08-30
63 000 
317  /m²(199 m²)
Sale
Apartments
Apartment
3 rooms
101 m2
Apartments
Apartment
4 rooms
98 m2
2 outbuildings
Land
111 m2
-Sols
2024-08-27
62 524 
313  /m²(200 m²)
Sale
Commercial property
200 m2
Land
533 m2
-Sols
2024-08-08
67 523 
Sale
Land
16290 m2
-Terres
Land
11220 m2
-Terres
Land
16440 m2
-Terres
Land
8640 m2
-Terres
Land
15690 m2
-Terres
Land
12150 m2
-Terres
Land
10420 m2
-Terres
Land
5350 m2
-Terres
Land
11368 m2
-Terres
Land
62 m2
-Terres
Land
9120 m2
-Terres
Land
12285 m2
-Terres
Land
14630 m2
-Prés
2024-07-29
95 000 
1 610  /m²(59 m²)
Sale
Houses
House
2 rooms
59 m2
Land
241 m2
-Jardins
Land
80 m2
-Sols
Land
23 m2
-Sols
2024-07-26
100 000 
1 010  /m²(99 m²)
Sale
Houses
House
4 rooms
99 m2
1 outbuilding
Land
360 m2
-Sols
Land
15 m2
-Sols
Land
46 m2
-Sols
2024-07-22
4 180 
Sale
Land
8580 m2
-Terres
Land
5380 m2
-Terres
2024-07-22
14 500 
Sale
Land
11800 m2
-Terres
Land
34505 m2
-Terres
Land
11125 m2
-Terres
2024-07-22
124 000 
1 107  /m²(112 m²)
Sale
Houses
House
6 rooms
112 m2
1 outbuilding
Land
702 m2
-Sols
Land
1134 m2
-Sols
Land
12130 m2
-Sols
Land
6000 m2
-Eaux
Land
357 m2
-Sols
2024-07-19
2 000 
Sale
Land
500 m2
-Sols
Land
1564 m2
-Terres
2024-07-09
195 000 
2 216  /m²(88 m²)
Sale
Houses
House
5 rooms
88 m2
1 outbuilding
Land
697 m2
-Sols
2024-03-25
122 000 
1 258  /m²(97 m²)
Sale
Houses
House
3 rooms
97 m2
2 outbuildings
Land
695 m2
-Sols
Land
600 m2
-Jardins
Land
275 m2
-Jardins
2024-03-21
3 330 
Sale
Land
85 m2
-Jardins
Land
144 m2
-Jardins
Land
40 m2
-Sols
Land
286 m2
-Sols
216 transactions listed in the municipality

Loire-Atlantique (44)

Most expensive cities

City
name
Descending orderHouses
house
Price per m²
5 313 
4 971 
4 956 
4 688 
4 625 
4 293 
4 255 
4 196 
City
name
Descending orderApartments
apt.
Price per m²
6 488 
5 441 
5 234 
5 158 
5 066 
4 590 

Least expensive cities

City
name
Ascending orderHouses
house
Price per m²
1 058 
1 071 
1 087 
1 178 
1 178 
1 275 
City
name
Ascending orderApartments
apt.
Price per m²
34 
146 
278 
483 
714 
727