emooki
HomePrice mapTransactions
🇬🇧 English🇫🇷 Français🇩🇪 Deutsch🇪🇸 Español🇮🇹 Italiano

Real estate price map


Real estate price map in the municipality of Ligné, choose a section to see transactions by parcel.

Loire-Atlantique (44)

Ligné - Real estate price m²

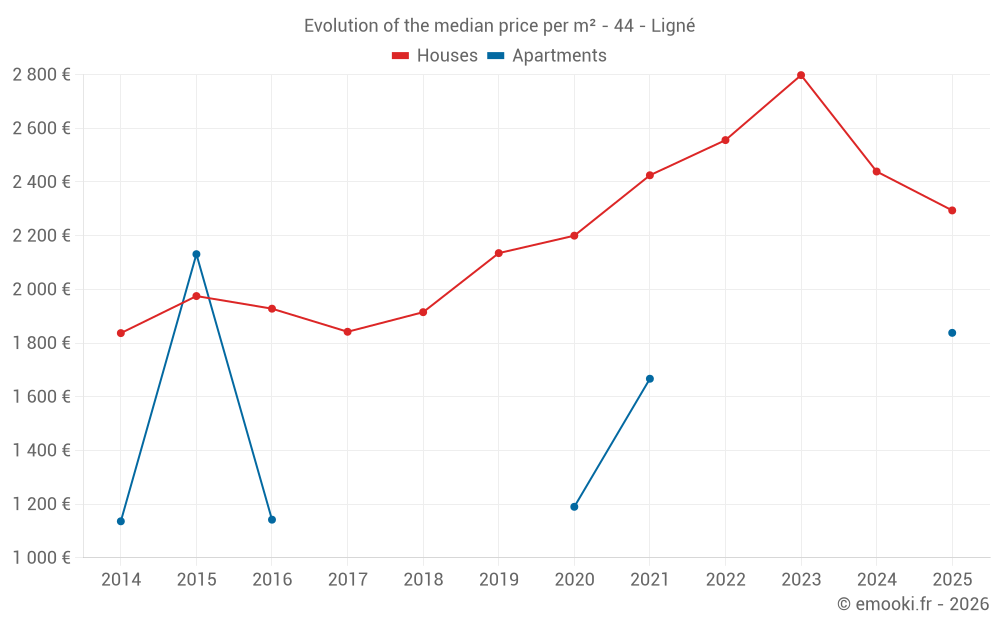
Median price of real estate
in the municipality of Ligné

HousesHouses
2 459  /m²
1-23-45-67-89-10
Reliability 8/10
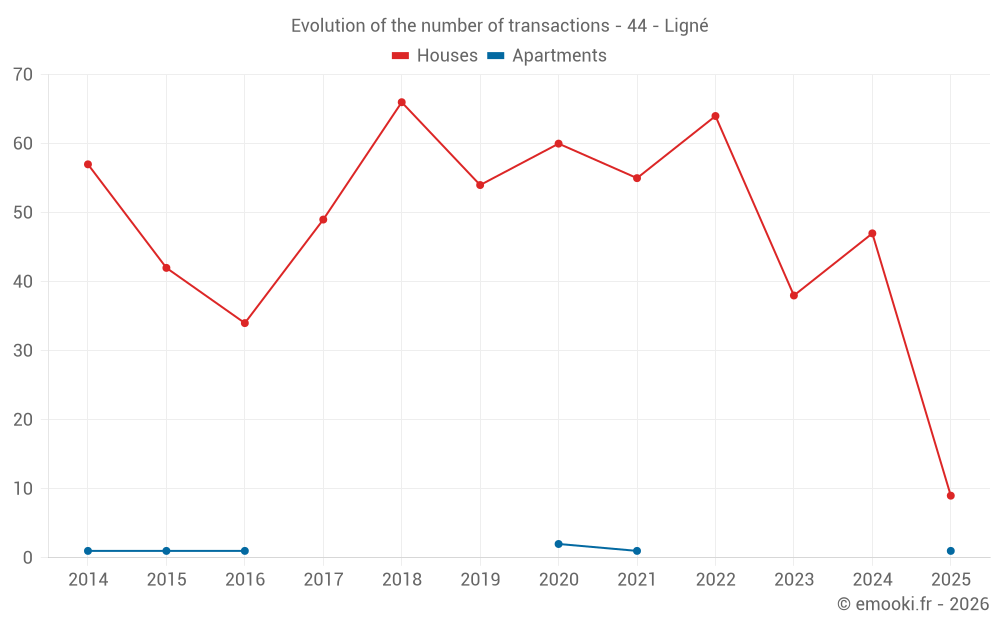
Median price on the 38 transactions of the last 12 months.
from 1 717 to
2 891  /m²
60% of transactions from the 2nd to the 8th deciles.
ApartmentsApartments
1 513  /m²
1-23-45-67-89-10
Reliability 2/10
Median price on the 4 transactions of the last 96 months.
DwellingsDwellings
2 439  /m²
1-23-45-67-89-10
Reliability 8/10
Median price on the 39 transactions of the last 12 months.
from 1 733 to
2 883  /m²
60% of transactions from the 2nd to the 8th deciles.
HousesEvolution of the price per m² of houses since...
1 year
-5.9%
2 years
-18%
3 years
-10%
4 years
-5.4%
5 years
+4.3%
6 years
+7.4%
7 years
+20%
8 years
+25%
9 years
+19%
10 years
+16%
11 years
+25%
The price per m² of houses has decreased by 18% since 2 years, but it has increased by 25% in 11 years.

Yearly evolution

Evolution of the median price per m²

Evolution of the median price per m² - 44 - Ligné

Evolution of the number of transactions

Warning, last year incomplete. Projections made based on the proportions between semesters of the previous year at the departmental/national level and by type of property.

Evolution of the number of transactions - 44 - Ligné

Yearly data

Descending order
Year
Houses
house
transactions
Houses
house
Price per m²
Apartments
apt.
transactions
Apartments
apt.
Price per m²
2025
9
2 294 
1
1 838 
2024
47
2 439 
0
--- 
2023
38
2 798 
0
--- 
2022
64
2 556 
0
--- 
2021
55
2 425 
1
1 667 
2020
60
2 200 
2
1 190 
2019
54
2 135 
0
--- 
2018
66
1 915 
0
--- 
2017
49
1 842 
0
--- 
2016
34
1 928 
1
1 142 
2015
42
1 975 
1
2 131 
2014
57
1 837 
1
1 136 

Analysis

Structure of prices per m²

Values of price percentiles per m² over the periods used for the estimated price of each type of property.

Structure of transaction amounts

Values of transaction amounts percentiles over the periods used for the estimated price of each type of property.

Transaction amounts and prices per m² by percentile

Ascending order
Percentile
Houses
house
Price per m²
Houses
house
Transaction amount
Apartments
apt.
Price per m²
Apartments
apt.
Transaction amount
10th percentile
1 023 
97 000 
1 122 
67 100 
20th percentile
1 717 
140 K
1 223 
81 200 
30th percentile
2 199 
180 K
1 325 
95 300 
40th percentile
2 339 
197 K
1 421 
105 K
50th percentile
2 459 
218 K
1 513 
113 K
60th percentile
2 576 
240 K
1 605 
120 K
70th percentile
2 741 
269 K
1 684 
126 K
80th percentile
2 891 
286 K
1 735 
127 K
90th percentile
3 005 
305 K
1 787 
129 K

National and departmental comparison

Evolution of the median price per m² of houses

Evolution of the median price per m² of apartments

Quarterly evolution

Evolution of the median price per m²

Evolution of the number of transactions

Quarterly data

Descending order
Quarter
Houses
house
transactions
Houses
house
Price per m²
Apartments
apt.
transactions
Apartments
apt.
Price per m²
2025 Q2
5
2 056 
0
--- 
2025 Q1
4
2 558 
1
1 838 
2024 Q4
10
2 356 
0
--- 
2024 Q3
19
2 673 
0
--- 
2024 Q2
14
2 428 
0
--- 
2024 Q1
4
2 159 
0
--- 
2023 Q4
9
2 614 
0
--- 
2023 Q3
11
2 806 
0
--- 
2023 Q2
14
2 951 
0
--- 
2023 Q1
4
2 169 
0
--- 
2022 Q4
14
2 864 
0
--- 
2022 Q3
16
2 798 
0
--- 
2022 Q2
16
2 222 
0
--- 
2022 Q1
18
2 638 
0
--- 
2021 Q4
7
2 921 
0
--- 
2021 Q3
27
2 577 
1
1 667 
2021 Q2
11
2 328 
0
--- 
2021 Q1
10
2 282 
0
--- 
2020 Q4
14
2 386 
0
--- 
2020 Q3
17
2 275 
0
--- 
2020 Q2
15
2 212 
1
1 359 
2020 Q1
14
1 722 
1
1 020 
2019 Q4
10
2 237 
0
--- 
2019 Q3
20
2 164 
0
--- 
2019 Q2
14
1 937 
0
--- 
2019 Q1
10
2 282 
0
--- 
2018 Q4
18
1 882 
0
--- 
2018 Q3
23
1 923 
0
--- 
2018 Q2
14
1 926 
0
--- 
2018 Q1
11
1 563 
0
--- 
2017 Q4
12
1 838 
0
--- 
2017 Q3
15
1 867 
0
--- 
2017 Q2
16
1 967 
0
--- 
2017 Q1
6
1 745 
0
--- 
2016 Q4
9
1 889 
1
1 142 
2016 Q3
15
2 011 
0
--- 
2016 Q2
7
1 855 
0
--- 
2016 Q1
3
1 471 
0
--- 
2015 Q4
18
2 100 
0
--- 
2015 Q3
16
1 926 
0
--- 
2015 Q2
6
1 481 
1
2 131 
2015 Q1
2
1 760 
0
--- 
2014 Q4
11
1 823 
0
--- 
2014 Q3
19
1 882 
0
--- 
2014 Q2
12
1 768 
1
1 136 
2014 Q1
15
1 847 
0
--- 

Overview of the latest real estate transactions

The following list is an anonymized overview of the latest transactions. For more details and to find all transactions, please use the map to view transactions by plot or the transaction search page for a search by criteria.

2025-06-03
81 500 
Sale
Land
326 m2
-Terrains à bâtir
2025-06-02
500 
Exchange
Land
75 m2
-Sols
Land
65 m2
-Sols
Land
16 m2
-Sols
Land
7 m2
-Sols
Land
37 m2
-Terres
Land
32 m2
-Terres
Land
22 m2
-Terres
2025-05-27
90 000 
989  /m²(91 m²)
Sale
Houses
House
5 rooms
91 m2
Land
1441 m2
-Sols
Land
2 m2
-Jardins
Land
227 m2
-Prés
Land
803 m2
-Sols
2025-05-23
429 000 
Sale
Land
179 m2
-Sols
Land
500 m2
-Prés
Land
7460 m2
-Terres
Land
28340 m2
-Terres
Land
21 m2
-Jardins
Land
5360 m2
-Terres
Land
10730 m2
-Terres
Land
14225 m2
-Terres
Land
42675 m2
-Terres
Land
192940 m2
-Terres
Land
55120 m2
-Terres
Land
17642 m2
-Terres
Land
2418 m2
-Prés
Land
14630 m2
-Terres
Land
21070 m2
-Terres
Land
64775 m2
-Terres
Land
31460 m2
-Terres
Land
41160 m2
-Terres
Land
63220 m2
-Terres
Land
280 m2
-Terres
Land
61286 m2
-Prés
Land
7826 m2
-Landes
Land
156842 m2
-Terres
Land
13521 m2
-Terres
Land
14301 m2
-Terres
Land
12357 m2
-Terres
Land
100000 m2
-Terres
Land
67720 m2
-Terres
Land
44750 m2
-Terres
Land
1560 m2
-Vignes
Land
6450 m2
-Terres
Land
60710 m2
-Terres
Land
47963 m2
-Terres
Land
52760 m2
-Terres
Land
39320 m2
-Terres
2025-05-22
260 000 
3 250  /m²(80 m²)
Sale
Houses
House
5 rooms
80 m2
2 outbuildings
Land
706 m2
-Sols
2025-05-19
10 000 
Sale
Land
21 m2
-Jardins
Land
97 m2
-Terrains à bâtir
2025-05-14
5 000 
Sale
Land
72 m2
-Sols
Land
43 m2
-Sols
Land
71 m2
-Jardins
2025-05-07
75 000 
Sale
Land
376 m2
-Terrains à bâtir
2025-05-05
100 000 
Sale
Land
522 m2
-Sols
2025-05-05
250 000 
Sale
Land
15 m2
-Sols
2025-04-28
1 
Sale
Land
1447 m2
-Sols
Land
13 m2
-Sols
Land
6 m2
-Sols
2025-04-25
15 678 
Sale
Land
5792 m2
-Prés
Land
54507 m2
-Terres
2025-04-24
273 000 
2 294  /m²(119 m²)
Sale
Houses
House
5 rooms
119 m2
1 outbuilding
Land
800 m2
-Sols
2025-04-23
185 000 
2 056  /m²(90 m²)
Sale
Houses
House
5 rooms
90 m2
1 outbuilding
Land
500 m2
-Sols
Land
1222 m2
-Terrains d'agrément
2025-04-14
180 000 
1 765  /m²(102 m²)
Sale
Houses
House
5 rooms
102 m2
Land
340 m2
-Sols
Land
176 m2
-Jardins
Land
55 m2
-Sols
2025-03-24
13 260 
Sale
Land
6440 m2
-Terres
Land
4187 m2
-Prés
Land
5863 m2
-Terres
Land
13840 m2
-Terres
Land
2147 m2
-Vignes
Land
6870 m2
-Terres
2025-03-24
290 000 
2 479  /m²(117 m²)
Sale
Houses
House
4 rooms
117 m2
1 outbuilding
Land
327 m2
-Terrains d'agrément
Land
1000 m2
-Sols
Land
1 m2
-Sols
2025-03-20
142 
Exchange
Land
7 m2
-Sols
2025-03-13
116 500 
Sale
Land
578 m2
-Terrains à bâtir
2025-03-13
1 
Sale
Land
2997 m2
-Terres
1198 transactions listed in the municipality

Loire-Atlantique (44)

Most expensive cities

City
name
Descending orderHouses
house
Price per m²
5 313 
4 971 
4 956 
4 688 
4 625 
4 293 
4 255 
4 196 
City
name
Descending orderApartments
apt.
Price per m²
6 488 
5 441 
5 234 
5 158 
5 066 
4 590 

Least expensive cities

City
name
Ascending orderHouses
house
Price per m²
1 058 
1 071 
1 087 
1 178 
1 178 
1 275 
City
name
Ascending orderApartments
apt.
Price per m²
34 
146 
278 
483 
714 
727