Median price of real estate
in the municipality of Gièvres
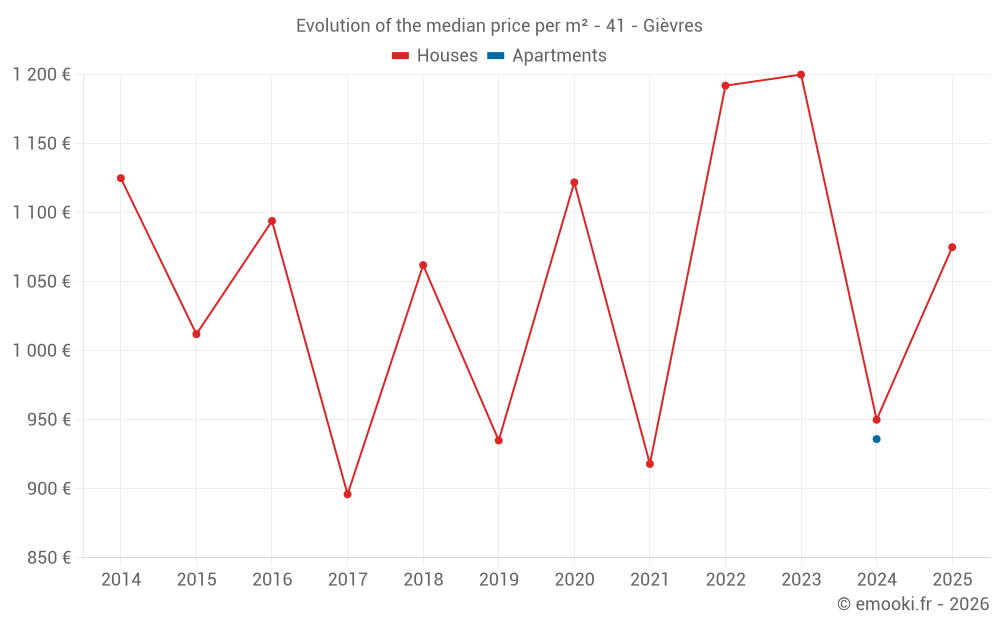
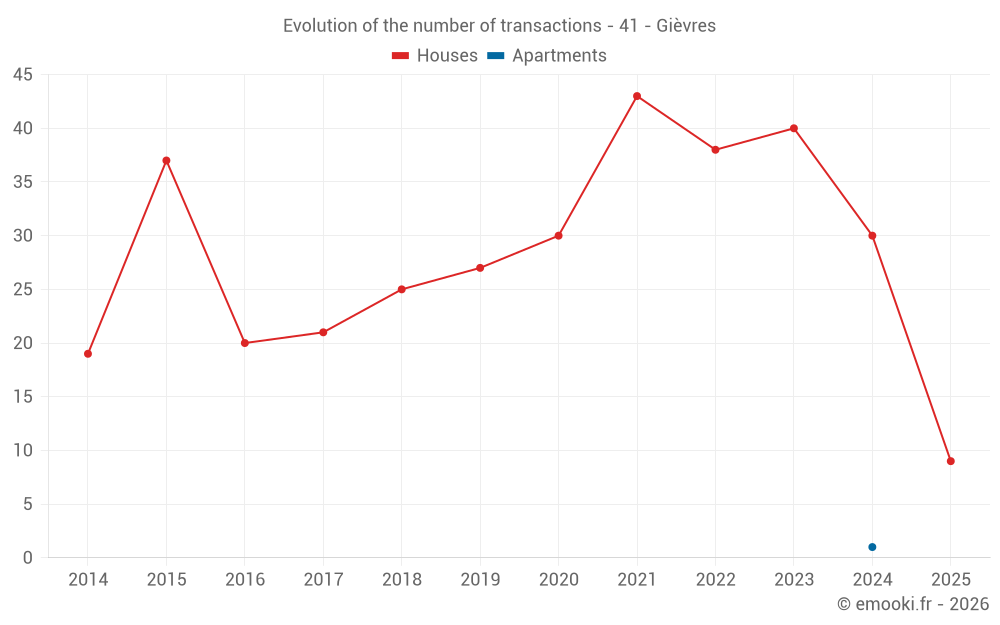
Houses
872 € /m²
Reliability 8/10
Median price on the 25 transactions of the last 12 months.
from 494 to
1 411 € /m²
1 411 € /m²
60% of transactions from the 2nd to the 8th deciles.
Apartments
936 € /m²
Reliability 1/10
Price of the unique transaction of the last 120 months.
Dwellings
890 € /m²
Reliability 8/10
Median price on the 26 transactions of the last 12 months.
from 500 to
1 382 € /m²
1 382 € /m²
60% of transactions from the 2nd to the 8th deciles.