emooki
HomePrice mapTransactions
🇬🇧 English🇫🇷 Français🇩🇪 Deutsch🇪🇸 Español🇮🇹 Italiano

Real estate price map


Real estate price map in the municipality of Vendôme, choose a section to see transactions by parcel.

Loir-et-Cher (41)
Vendôme

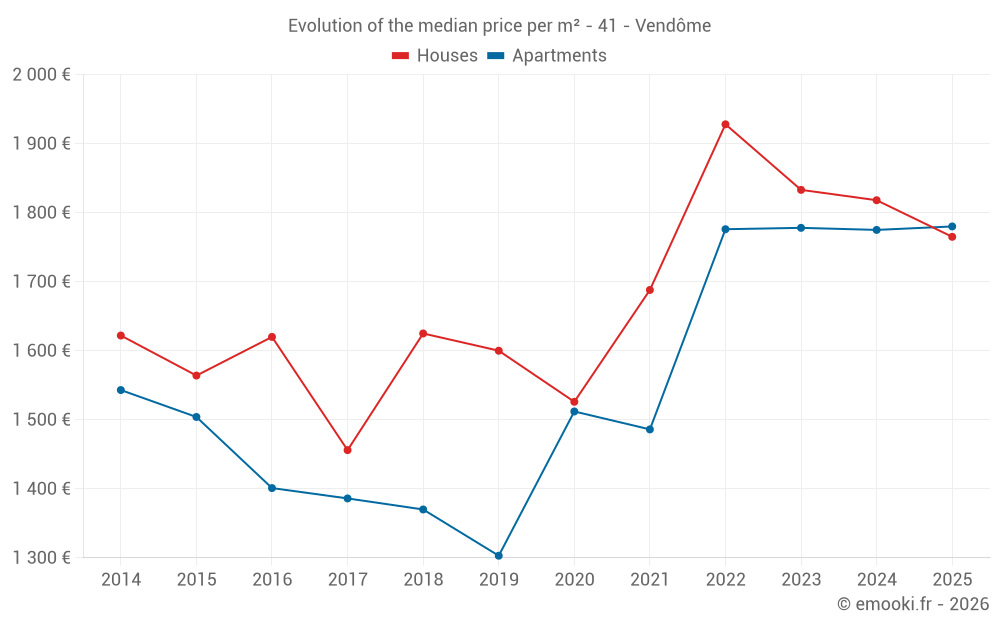
Median price of real estate
in the municipality of Vendôme

HousesHouses
1 765  /m²
1-23-45-67-89-10
Reliability 9/10
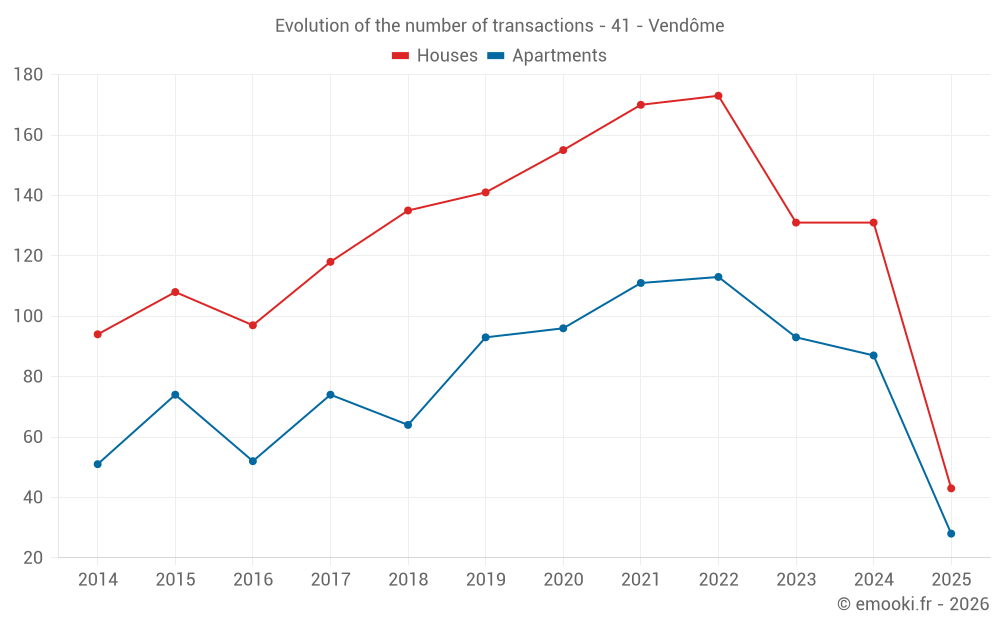
Median price on the 43 transactions of the last 6 months.
from 1 384 to
2 262  /m²
60% of transactions from the 2nd to the 8th deciles.
ApartmentsApartments
1 780  /m²
1-23-45-67-89-10
Reliability 9/10
Median price on the 28 transactions of the last 6 months.
from 1 475 to
2 090  /m²
60% of transactions from the 2nd to the 8th deciles.
DwellingsDwellings
1 648  /m²
1-23-45-67-89-10
Reliability 10/10
Median price on the 22 transactions of the last 3 months.
from 1 361 to
2 208  /m²
60% of transactions from the 2nd to the 8th deciles.
HousesEvolution of the price per m² of houses since...
1 year
-2.9%
2 years
-3.7%
3 years
-8.5%
4 years
+4.6%
5 years
+16%
6 years
+10%
7 years
+8.6%
8 years
+21%
9 years
+9%
10 years
+13%
11 years
+8.8%
The price per m² of houses has decreased by 8.5% since 3 years, but it has increased by 21% in 8 years.
ApartmentsEvolution of the price per m² of apartments since...
1 year
+0.3%
2 years
+0.1%
3 years
+0.2%
4 years
+20%
5 years
+18%
6 years
+37%
7 years
+30%
8 years
+28%
9 years
+27%
10 years
+18%
11 years
+15%

Yearly evolution

Evolution of the median price per m²

Evolution of the median price per m² - 41 - Vendôme

Evolution of the number of transactions

Warning, last year incomplete. Projections made based on the proportions between semesters of the previous year at the departmental/national level and by type of property.

Evolution of the number of transactions - 41 - Vendôme

Yearly data

Descending order
Year
Houses
house
transactions
Houses
house
Price per m²
Apartments
apt.
transactions
Apartments
apt.
Price per m²
2025
43
1 765 
28
1 780 
2024
131
1 818 
87
1 775 
2023
131
1 833 
93
1 778 
2022
173
1 928 
113
1 776 
2021
170
1 688 
111
1 486 
2020
155
1 526 
96
1 512 
2019
141
1 600 
93
1 303 
2018
135
1 625 
64
1 370 
2017
118
1 456 
74
1 386 
2016
97
1 620 
52
1 401 
2015
108
1 564 
74
1 504 
2014
94
1 622 
51
1 543 

Analysis

Structure of prices per m²

Values of price percentiles per m² over the periods used for the estimated price of each type of property.

Structure of transaction amounts

Values of transaction amounts percentiles over the periods used for the estimated price of each type of property.

Transaction amounts and prices per m² by percentile

Ascending order
Percentile
Houses
house
Price per m²
Houses
house
Transaction amount
Apartments
apt.
Price per m²
Apartments
apt.
Transaction amount
10th percentile
1 207 
90 400 
1 325 
45 380 
20th percentile
1 384 
112 K
1 475 
71 011 
30th percentile
1 504 
126 K
1 611 
85 216 
40th percentile
1 673 
130 K
1 688 
94 600 
50th percentile
1 765 
140 K
1 780 
113 K
60th percentile
1 908 
147 K
1 855 
129 K
70th percentile
2 065 
174 K
2 017 
142 K
80th percentile
2 262 
214 K
2 090 
154 K
90th percentile
2 435 
263 K
2 155 
172 K

National and departmental comparison

Evolution of the median price per m² of houses

Evolution of the median price per m² of apartments

Quarterly evolution

Evolution of the median price per m²

Evolution of the number of transactions

Quarterly data

Descending order
Quarter
Houses
house
transactions
Houses
house
Price per m²
Apartments
apt.
transactions
Apartments
apt.
Price per m²
2025 Q2
15
1 691 
7
1 605 
2025 Q1
28
1 870 
21
1 843 
2024 Q4
34
1 778 
18
1 880 
2024 Q3
29
1 791 
21
1 761 
2024 Q2
35
1 912 
34
1 815 
2024 Q1
33
1 717 
14
1 749 
2023 Q4
33
1 869 
22
1 667 
2023 Q3
33
1 808 
27
1 778 
2023 Q2
36
1 866 
23
1 788 
2023 Q1
29
1 908 
21
1 889 
2022 Q4
40
1 952 
26
1 944 
2022 Q3
58
1 955 
29
1 782 
2022 Q2
40
1 950 
33
1 776 
2022 Q1
35
1 744 
25
1 516 
2021 Q4
39
1 769 
30
1 477 
2021 Q3
43
1 757 
37
1 524 
2021 Q2
43
1 794 
20
1 602 
2021 Q1
45
1 571 
24
1 432 
2020 Q4
49
1 599 
32
1 530 
2020 Q3
42
1 576 
19
1 628 
2020 Q2
38
1 510 
15
1 366 
2020 Q1
26
1 432 
30
1 382 
2019 Q4
37
1 406 
34
1 403 
2019 Q3
40
1 677 
20
1 314 
2019 Q2
37
1 619 
23
1 238 
2019 Q1
27
1 518 
16
1 098 
2018 Q4
37
1 697 
22
1 482 
2018 Q3
26
1 678 
16
1 338 
2018 Q2
39
1 561 
14
1 330 
2018 Q1
33
1 489 
12
1 169 
2017 Q4
32
1 527 
18
1 445 
2017 Q3
37
1 464 
17
1 522 
2017 Q2
28
1 382 
19
1 346 
2017 Q1
21
1 575 
20
1 378 
2016 Q4
21
1 557 
11
1 440 
2016 Q3
29
1 620 
18
1 543 
2016 Q2
26
1 660 
10
1 280 
2016 Q1
21
1 612 
13
1 301 
2015 Q4
30
1 588 
14
1 472 
2015 Q3
28
1 510 
25
1 480 
2015 Q2
24
1 644 
14
1 610 
2015 Q1
26
1 534 
21
1 500 
2014 Q4
30
1 670 
12
1 732 
2014 Q3
26
1 512 
16
1 557 
2014 Q2
21
1 933 
12
1 282 
2014 Q1
17
1 520 
11
1 410 

Overview of the latest real estate transactions

The following list is an anonymized overview of the latest transactions. For more details and to find all transactions, please use the map to view transactions by plot or the transaction search page for a search by criteria.

2025-06-27
390 000 
2 294  /m²(170 m²)
Sale
Houses
House
5 rooms
170 m2
Land
500 m2
-Sols
Land
540 m2
-Terrains d'agrément
2025-06-26
315 000 
1 212  /m²(260 m²)
Sale
Commercial property
260 m2
2025-06-25
1 
Sale
Commercial property
Land
219 m2
-Sols
Commercial property
Land
6031 m2
-Taillis simples
Land
3089 m2
-Sols
Land
130 m2
-Prés
Land
1200 m2
-Prés
2025-06-24
142 000 
1 690  /m²(84 m²)
Sale
Apartments
Apartment
4 rooms
84 m2
2 outbuildings
2025-06-12
120 000 
1 237  /m²(97 m²)
Sale
Land
152 m2
-Sols
Houses
House
5 rooms
97 m2
Land
126 m2
-Sols
Land
74 m2
-Sols
2025-06-12
135 000 
1 500  /m²(90 m²)
Sale
Houses
House
4 rooms
90 m2
Land
546 m2
-Sols
2025-06-12
142 000 
871  /m²(163 m²)
Sale
Houses
House
5 rooms
163 m2
Land
775 m2
-Sols
2025-06-03
280 000 
1 547  /m²(181 m²)
1 986  /m²(141 m²)
Sale
Apartments
Apartment
2 rooms
47 m2
Apartments
Apartment
2 rooms
47 m2
Apartments
Apartment
2 rooms
47 m2
Commercial property
40 m2
3 outbuildings
Land
85 m2
-Sols
2025-05-23
78 000 
1 472  /m²(53 m²)
Sale
Houses
House
2 rooms
53 m2
Land
334 m2
-Sols
2025-05-21
130 000 
1 711  /m²(76 m²)
Sale
Houses
House
4 rooms
76 m2
Land
619 m2
-Sols
2025-05-20
40 500 
1 688  /m²(24 m²)
Sale
Commercial property
24 m2
2025-05-16
114 600 
1 528  /m²(75 m²)
Sale
Houses
House
5 rooms
75 m2
Land
541 m2
-Sols
2025-05-15
40 000 
Sale
Land
368 m2
-Sols
Land
94 m2
-Sols
2025-05-13
120 000 
1 395  /m²(86 m²)
Sale
Houses
House
4 rooms
86 m2
1 outbuilding
Land
532 m2
-Sols
2025-05-12
171 400 
2 449  /m²(70 m²)
Sale
Houses
House
4 rooms
70 m2
Land
357 m2
-Sols
2025-05-12
240 000 
1 678  /m²(143 m²)
Sale
Commercial property
143 m2
2025-05-07
126 000 
536  /m²(235 m²)
Sale
Apartments
Apartment
2 rooms
43 m2
Apartments
Apartment
2 rooms
41 m2
Apartments
Apartment
2 rooms
31 m2
Apartments
Apartment
6 rooms
120 m2
1 outbuilding
Land
194 m2
-Sols
2025-05-05
705 000 
2 820  /m²(250 m²)
Sale
Houses
House
7 rooms
250 m2
4 outbuildings
Land
1585 m2
-Jardins
Land
767 m2
-Sols
Land
134 m2
-Jardins
Land
439 m2
-Taillis simples
Land
5499 m2
-Taillis simples
Land
6407 m2
-Prés
2025-04-30
95 000 
1 357  /m²(70 m²)
Sale
Apartments
Apartment
3 rooms
70 m2
1 outbuilding
1 outbuilding
2025-04-30
77 027 
975  /m²(79 m²)
Sale
Apartments
Apartment
3 rooms
79 m2
2 outbuildings
3581 transactions listed in the municipality

Loir-et-Cher (41)

Most expensive cities

City
name
Descending orderHouses
house
Price per m²
2 296 
2 146 
2 061 
2 032 
2 016 
1 977 
City
name
Descending orderApartments
apt.
Price per m²
4 857 
3 653 
2 320 
1 780 
1 771 
1 731 
1 725 

Least expensive cities

City
name
Ascending orderHouses
house
Price per m²
697 
732 
736 
750 
770 
790 
834 
836 
City
name
Ascending orderApartments
apt.
Price per m²
217 
232 
320 
355 
391