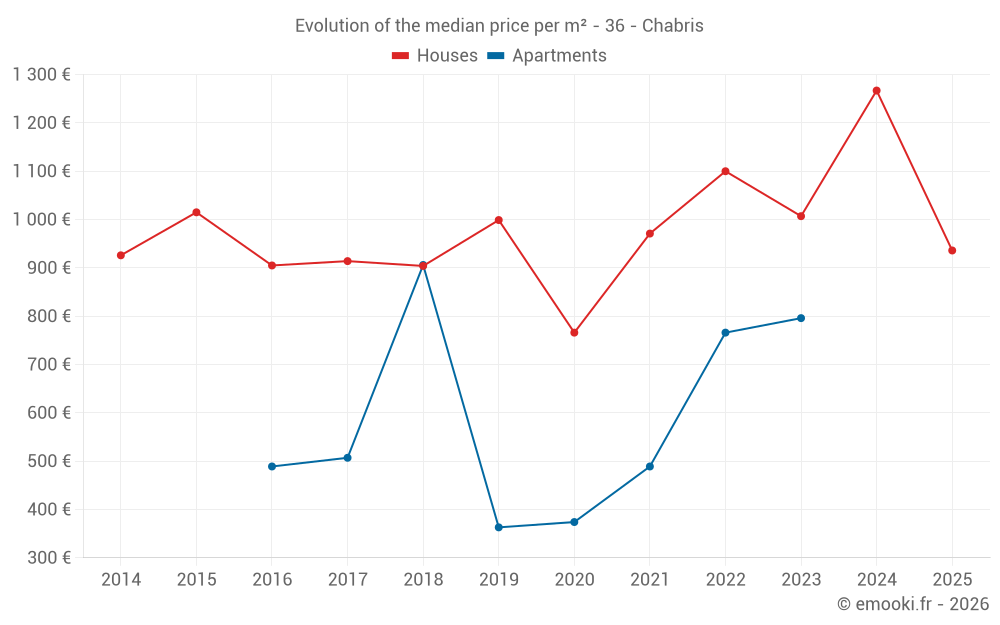
Median price of real estate
in the municipality of Chabris
Houses
936 € /m²
Reliability 9/10
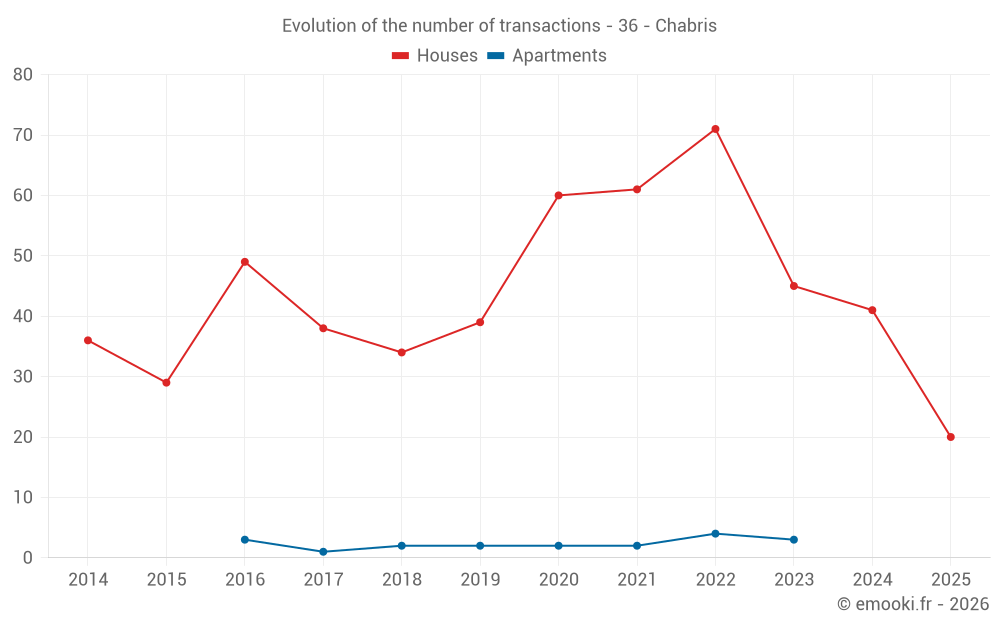
Median price on the 20 transactions of the last 6 months.
from 752 to
1 319 € /m²
1 319 € /m²
60% of transactions from the 2nd to the 8th deciles.
Apartments
682 € /m²
Reliability 4/10
Median price on the 11 transactions of the last 60 months.
from 315 to
796 € /m²
796 € /m²
60% of transactions from the 2nd to the 8th deciles.
Dwellings
936 € /m²
Reliability 9/10
Median price on the 20 transactions of the last 6 months.
from 752 to
1 319 € /m²
1 319 € /m²
60% of transactions from the 2nd to the 8th deciles.