emooki
HomePrice mapTransactions
🇬🇧 English🇫🇷 Français🇩🇪 Deutsch🇪🇸 Español🇮🇹 Italiano

Real estate price map


Real estate price map in the municipality of La Chaussée-Saint-Victor.

Loir-et-Cher (41)
La Chaussée-Saint-Victor

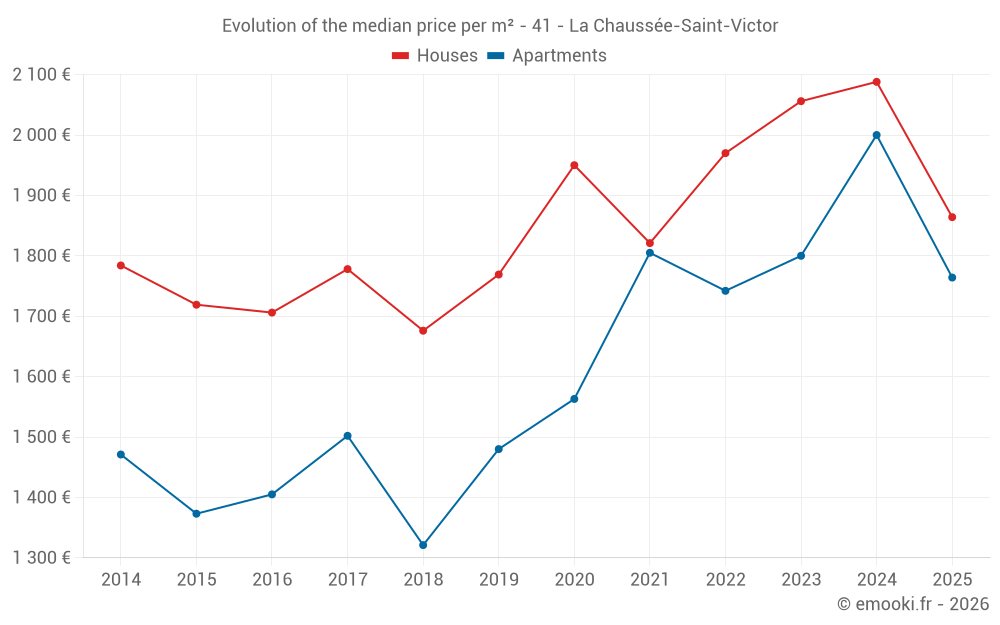
Median price of real estate
in the municipality of La Chaussée-Saint-Victor

HousesHouses
2 088  /m²
1-23-45-67-89-10
Reliability 8/10
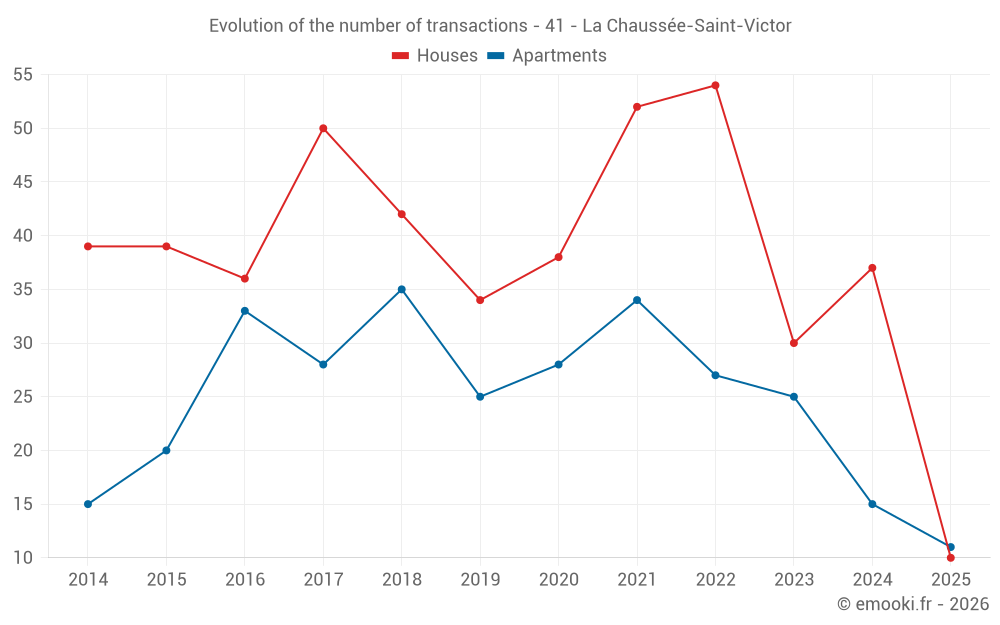
Median price on the 33 transactions of the last 12 months.
from 1 556 to
2 285  /m²
60% of transactions from the 2nd to the 8th deciles.
ApartmentsApartments
1 844  /m²
1-23-45-67-89-10
Reliability 8/10
Median price on the 21 transactions of the last 12 months.
from 1 636 to
2 222  /m²
60% of transactions from the 2nd to the 8th deciles.
DwellingsDwellings
1 800  /m²
1-23-45-67-89-10
Reliability 9/10
Median price on the 21 transactions of the last 6 months.
from 1 375 to
2 105  /m²
60% of transactions from the 2nd to the 8th deciles.
HousesEvolution of the price per m² of houses since...
1 year
-11%
2 years
-9.3%
3 years
-5.4%
4 years
+2.4%
5 years
-4.4%
6 years
+5.4%
7 years
+11%
8 years
+4.8%
9 years
+9.3%
10 years
+8.4%
11 years
+4.5%
ApartmentsEvolution of the price per m² of apartments since...
1 year
-12%
2 years
-2%
3 years
+1.3%
4 years
-2.3%
5 years
+13%
6 years
+19%
7 years
+34%
8 years
+17%
9 years
+26%
10 years
+28%
11 years
+20%

Yearly evolution

Evolution of the median price per m²

Evolution of the number of transactions

Warning, last year incomplete. Projections made based on the proportions between semesters of the previous year at the departmental/national level and by type of property.

Yearly data

Descending order
Year
Houses
house
transactions
Houses
house
Price per m²
Apartments
apt.
transactions
Apartments
apt.
Price per m²
2025
10
1 864 
11
1 764 
2024
37
2 088 
15
2 000 
2023
30
2 056 
25
1 800 
2022
54
1 970 
27
1 742 
2021
52
1 821 
34
1 805 
2020
38
1 950 
28
1 563 
2019
34
1 769 
25
1 480 
2018
42
1 676 
35
1 321 
2017
50
1 778 
28
1 502 
2016
36
1 706 
33
1 405 
2015
39
1 719 
20
1 373 
2014
39
1 784 
15
1 471 

Analysis

Structure of prices per m²

Values of price percentiles per m² over the periods used for the estimated price of each type of property.

Structure of transaction amounts

Values of transaction amounts percentiles over the periods used for the estimated price of each type of property.

Transaction amounts and prices per m² by percentile

Ascending order
Percentile
Houses
house
Price per m²
Houses
house
Transaction amount
Apartments
apt.
Price per m²
Apartments
apt.
Transaction amount
10th percentile
1 470 
122 K
1 375 
83 000 
20th percentile
1 556 
136 K
1 636 
86 000 
30th percentile
1 730 
161 K
1 745 
93 000 
40th percentile
1 927 
174 K
1 800 
96 000 
50th percentile
2 088 
185 K
1 844 
108 K
60th percentile
2 208 
213 K
2 000 
120 K
70th percentile
2 265 
232 K
2 143 
125 K
80th percentile
2 285 
274 K
2 222 
139 K
90th percentile
2 604 
302 K
2 255 
148 K

National and departmental comparison

Evolution of the median price per m² of houses

Evolution of the median price per m² of apartments

Quarterly evolution

Evolution of the median price per m²

Evolution of the number of transactions

Quarterly data

Descending order
Quarter
Houses
house
transactions
Houses
house
Price per m²
Apartments
apt.
transactions
Apartments
apt.
Price per m²
2025 Q2
3
2 105 
6
1 735 
2025 Q1
7
1 739 
5
1 844 
2024 Q4
9
2 088 
6
2 120 
2024 Q3
14
2 242 
4
1 866 
2024 Q2
9
1 910 
2
1 955 
2024 Q1
5
1 818 
3
2 311 
2023 Q4
6
2 074 
9
1 748 
2023 Q3
11
1 982 
8
1 854 
2023 Q2
5
2 169 
6
1 740 
2023 Q1
8
2 008 
2
1 956 
2022 Q4
8
1 871 
9
1 742 
2022 Q3
23
2 245 
9
1 875 
2022 Q2
13
1 941 
7
1 647 
2022 Q1
10
2 080 
2
1 503 
2021 Q4
10
1 870 
17
1 699 
2021 Q3
13
1 839 
9
1 963 
2021 Q2
18
1 816 
3
1 574 
2021 Q1
11
1 716 
5
2 000 
2020 Q4
12
1 806 
9
1 609 
2020 Q3
10
1 978 
3
1 167 
2020 Q2
9
1 854 
10
1 563 
2020 Q1
7
2 000 
6
1 737 
2019 Q4
8
1 887 
3
1 598 
2019 Q3
12
1 682 
8
1 440 
2019 Q2
6
1 870 
7
1 594 
2019 Q1
8
1 757 
7
1 383 
2018 Q4
16
1 694 
12
1 459 
2018 Q3
9
1 747 
12
1 316 
2018 Q2
7
1 589 
5
1 172 
2018 Q1
10
1 642 
6
1 576 
2017 Q4
12
1 520 
6
1 552 
2017 Q3
20
1 785 
8
1 488 
2017 Q2
7
1 811 
5
1 680 
2017 Q1
11
1 806 
9
1 449 
2016 Q4
5
1 699 
7
1 421 
2016 Q3
13
1 655 
9
1 420 
2016 Q2
8
1 800 
7
1 176 
2016 Q1
10
1 630 
10
1 426 
2015 Q4
10
1 906 
4
1 438 
2015 Q3
14
1 620 
8
1 390 
2015 Q2
11
1 824 
4
1 311 
2015 Q1
4
1 815 
4
1 074 
2014 Q4
11
1 620 
3
1 471 
2014 Q3
8
1 820 
5
1 543 
2014 Q2
11
1 784 
4
1 340 
2014 Q1
9
1 905 
3
1 462 

Loir-et-Cher (41)

Most expensive cities

City
name
Descending orderHouses
house
Price per m²
2 296 
2 146 
2 061 
2 032 
2 016 
1 977 
City
name
Descending orderApartments
apt.
Price per m²
4 857 
3 653 
2 320 
1 780 
1 771 
1 731 
1 725 

Least expensive cities

City
name
Ascending orderHouses
house
Price per m²
697 
732 
736 
750 
770 
790 
834 
836 
City
name
Ascending orderApartments
apt.
Price per m²
217 
232 
320 
355 
391