emooki
HomePrice mapTransactions
🇬🇧 English🇫🇷 Français🇩🇪 Deutsch🇪🇸 Español🇮🇹 Italiano

Real estate price map


Real estate price map in the municipality of Dax, choose a section to see transactions by parcel.

Landes (40)

Dax - Real estate price m²

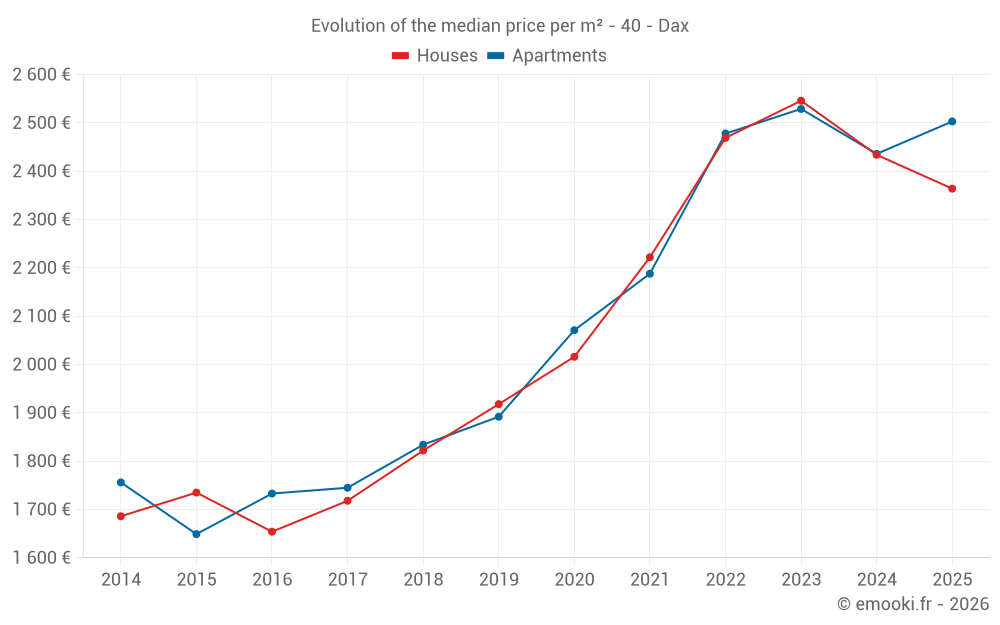
Median price of real estate
in the municipality of Dax

HousesHouses
2 468  /m²
1-23-45-67-89-10
Reliability 10/10
Median price on the 21 transactions of the last 3 months.
from 1 877 to
2 979  /m²
60% of transactions from the 2nd to the 8th deciles.
ApartmentsApartments
2 574  /m²
1-23-45-67-89-10
Reliability 10/10
Median price on the 80 transactions of the last 3 months.
from 2 135 to
2 894  /m²
60% of transactions from the 2nd to the 8th deciles.
DwellingsDwellings
2 563  /m²
1-23-45-67-89-10
Reliability 10/10
Median price on the 101 transactions of the last 3 months.
from 2 125 to
2 972  /m²
60% of transactions from the 2nd to the 8th deciles.
HousesEvolution of the price per m² of houses since...
1 year
-2.9%
2 years
-7.1%
3 years
-4.3%
4 years
+6.4%
5 years
+17%
6 years
+23%
7 years
+30%
8 years
+38%
9 years
+43%
10 years
+36%
11 years
+40%
The price per m² of houses has decreased by 7.1% since 2 years, but it has increased by 43% in 9 years.
ApartmentsEvolution of the price per m² of apartments since...
1 year
+2.8%
2 years
-1%
3 years
+1%
4 years
+14%
5 years
+21%
6 years
+32%
7 years
+36%
8 years
+43%
9 years
+44%
10 years
+52%
11 years
+43%
The price per m² of apartments has decreased by 1% since 2 years, but it has increased by 52% in 10 years.

Yearly evolution

Evolution of the median price per m²

Evolution of the median price per m² - 40 - Dax

Evolution of the number of transactions

Warning, last year incomplete. Projections made based on the proportions between semesters of the previous year at the departmental/national level and by type of property.

Evolution of the number of transactions - 40 - Dax

Yearly data

Descending order
Year
Houses
house
transactions
Houses
house
Price per m²
Apartments
apt.
transactions
Apartments
apt.
Price per m²
2025
51
2 364 
161
2 503 
2024
145
2 434 
311
2 436 
2023
143
2 546 
395
2 529 
2022
167
2 469 
515
2 478 
2021
207
2 222 
403
2 188 
2020
176
2 016 
393
2 071 
2019
179
1 918 
416
1 892 
2018
182
1 822 
386
1 834 
2017
168
1 718 
351
1 745 
2016
150
1 654 
235
1 733 
2015
115
1 735 
235
1 649 
2014
112
1 686 
210
1 756 

Analysis

Structure of prices per m²

Values of price percentiles per m² over the periods used for the estimated price of each type of property.

Structure of transaction amounts

Values of transaction amounts percentiles over the periods used for the estimated price of each type of property.

Transaction amounts and prices per m² by percentile

Ascending order
Percentile
Houses
house
Price per m²
Houses
house
Transaction amount
Apartments
apt.
Price per m²
Apartments
apt.
Transaction amount
10th percentile
1 584 
141 K
1 739 
58 785 
20th percentile
1 877 
155 K
2 135 
66 000 
30th percentile
2 240 
202 K
2 263 
84 700 
40th percentile
2 297 
210 K
2 449 
89 200 
50th percentile
2 468 
219 K
2 574 
115 K
60th percentile
2 500 
250 K
2 681 
129 K
70th percentile
2 663 
255 K
2 800 
153 K
80th percentile
2 979 
280 K
2 894 
174 K
90th percentile
3 433 
333 K
3 277 
193 K

National and departmental comparison

Evolution of the median price per m² of houses

Evolution of the median price per m² of apartments

Quarterly evolution

Evolution of the median price per m²

Evolution of the number of transactions

Quarterly data

Descending order
Quarter
Houses
house
transactions
Houses
house
Price per m²
Apartments
apt.
transactions
Apartments
apt.
Price per m²
2025 Q2
21
2 468 
80
2 574 
2025 Q1
30
2 354 
81
2 429 
2024 Q4
38
2 367 
83
2 391 
2024 Q3
45
2 496 
97
2 391 
2024 Q2
36
2 432 
62
2 507 
2024 Q1
26
2 492 
69
2 581 
2023 Q4
27
2 439 
102
2 513 
2023 Q3
43
2 618 
90
2 488 
2023 Q2
39
2 340 
98
2 564 
2023 Q1
34
2 570 
105
2 550 
2022 Q4
43
2 564 
126
2 568 
2022 Q3
46
2 727 
120
2 510 
2022 Q2
38
2 260 
161
2 455 
2022 Q1
40
2 276 
108
2 325 
2021 Q4
46
2 425 
120
2 208 
2021 Q3
68
2 388 
93
2 176 
2021 Q2
45
2 117 
113
2 131 
2021 Q1
48
1 912 
77
2 250 
2020 Q4
49
2 040 
110
2 062 
2020 Q3
51
1 885 
96
2 104 
2020 Q2
46
2 111 
88
2 042 
2020 Q1
30
1 820 
99
2 073 
2019 Q4
37
1 949 
99
2 039 
2019 Q3
57
1 930 
122
1 842 
2019 Q2
53
1 806 
104
1 893 
2019 Q1
32
1 936 
91
1 828 
2018 Q4
39
1 837 
93
1 873 
2018 Q3
51
1 900 
124
1 805 
2018 Q2
44
1 643 
79
1 793 
2018 Q1
48
1 820 
90
1 844 
2017 Q4
41
1 847 
84
1 718 
2017 Q3
52
1 600 
72
1 826 
2017 Q2
33
1 845 
106
1 756 
2017 Q1
42
1 784 
89
1 659 
2016 Q4
41
1 694 
57
1 718 
2016 Q3
35
1 666 
70
1 841 
2016 Q2
41
1 693 
56
1 530 
2016 Q1
33
1 566 
52
1 693 
2015 Q4
31
1 609 
69
1 545 
2015 Q3
34
1 801 
67
1 726 
2015 Q2
24
1 728 
46
1 482 
2015 Q1
26
1 718 
53
1 875 
2014 Q4
23
1 696 
47
1 670 
2014 Q3
24
1 732 
39
1 849 
2014 Q2
29
1 663 
65
1 826 
2014 Q1
36
1 602 
59
1 742 

Overview of the latest real estate transactions

The following list is an anonymized overview of the latest transactions. For more details and to find all transactions, please use the map to view transactions by plot or the transaction search page for a search by criteria.

2025-06-27
41 000 
Sale
1 outbuilding
2025-06-20
69 500 
3 159  /m²(22 m²)
Sale
Apartments
Apartment
1 room
22 m2
1 outbuilding
1 outbuilding
2025-06-20
56 000 
3 294  /m²(17 m²)
Sale
Apartments
Apartment
1 room
17 m2
2025-06-19
500 000 
Sale
Land
571 m2
-Terrains à bâtir
Land
6962 m2
-Terrains à bâtir
2025-06-13
150 000 
1 852  /m²(81 m²)
Sale
Houses
House
3 rooms
81 m2
Land
643 m2
-Sols
2025-06-11
198 000 
2 829  /m²(70 m²)
Sale
Apartments
Apartment
4 rooms
70 m2
1 outbuilding
2025-06-11
121 000 
1 344  /m²(90 m²)
Sale
Apartments
Apartment
4 rooms
90 m2
2025-06-06
180 400 
2 255  /m²(80 m²)
Sale
Apartments
Apartment
3 rooms
80 m2
2025-06-05
1 
Sale
Land
204 m2
-Jardins
/Pré marais
Land
5 m2
-Sols
Land
171 m2
-Sols
2025-06-02
114 000 
3 353  /m²(34 m²)
Sale
Apartments
Apartment
2 rooms
34 m2
1 outbuilding
2025-05-30
105 000 
Sale
Land
585 m2
-Terrains à bâtir
2025-05-30
125 110 
2 606  /m²(48 m²)
Sale
Apartments
Apartment
2 rooms
48 m2
2 outbuildings
2025-05-30
185 000 
1 888  /m²(98 m²)
Sale
Apartments
Apartment
4 rooms
98 m2
1 outbuilding
1 outbuilding
2025-05-30
115 000 
2 255  /m²(51 m²)
Sale
Apartments
Apartment
3 rooms
51 m2
1 outbuilding
2025-05-28
88 000 
1 796  /m²(49 m²)
Sale
Apartments
Apartment
2 rooms
49 m2
2025-05-28
76 150 
3 626  /m²(21 m²)
Sale
Apartments
Apartment
1 room
21 m2
2025-05-28
280 000 
2 979  /m²(94 m²)
Sale
Houses
House
5 rooms
94 m2
2 outbuildings
Land
1658 m2
-Sols
2025-05-28
214 000 
2 972  /m²(72 m²)
Sale
Houses
House
4 rooms
72 m2
Land
638 m2
-Sols
2025-05-28
189 000 
1 050  /m²(180 m²)
Sale
Commercial property
180 m2
Land
246 m2
-Sols
Land
67 m2
-Sols
Land
28 m2
-Sols
Land
45 m2
-Sols
2025-05-28
450 700 
2 254  /m²(200 m²)
Sale
Houses
House
6 rooms
200 m2
1 outbuilding
Land
330 m2
-Sols
7935 transactions listed in the municipality

Landes (40)

Most expensive cities

City
name
Descending orderHouses
house
Price per m²
10 244 
6 941 
6 776 
5 777 
4 891 
4 761 
4 725 
4 675 
4 670 
City
name
Descending orderApartments
apt.
Price per m²
8 278 
6 022 
5 835 
4 582 
4 476 
4 261 
4 208 
4 126 
3 985 

Least expensive cities

City
name
Ascending orderHouses
house
Price per m²
596 
776 
819 
825 
828 
886 
886 
City
name
Ascending orderApartments
apt.
Price per m²
222 
392 
431 
500 
510 
556