emooki
HomePrice mapTransactions
🇬🇧 English🇫🇷 Français🇩🇪 Deutsch🇪🇸 Español🇮🇹 Italiano

Real estate price map


Real estate price map in the municipality of Tosse, choose a section to see transactions by parcel.

Landes (40)

Tosse - Real estate price m²

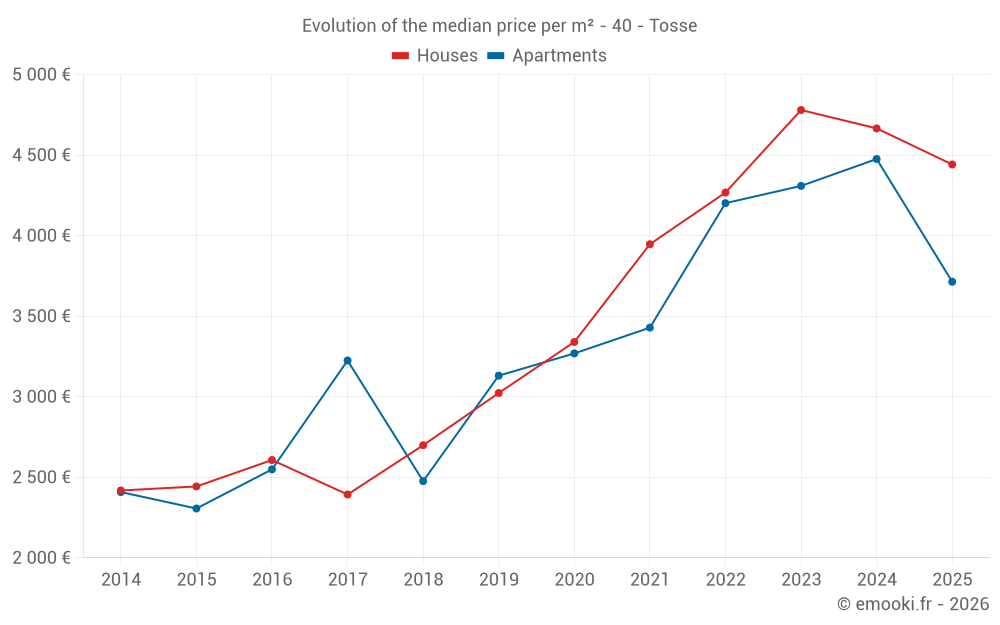
Median price of real estate
in the municipality of Tosse

HousesHouses
4 442  /m²
1-23-45-67-89-10
Reliability 9/10
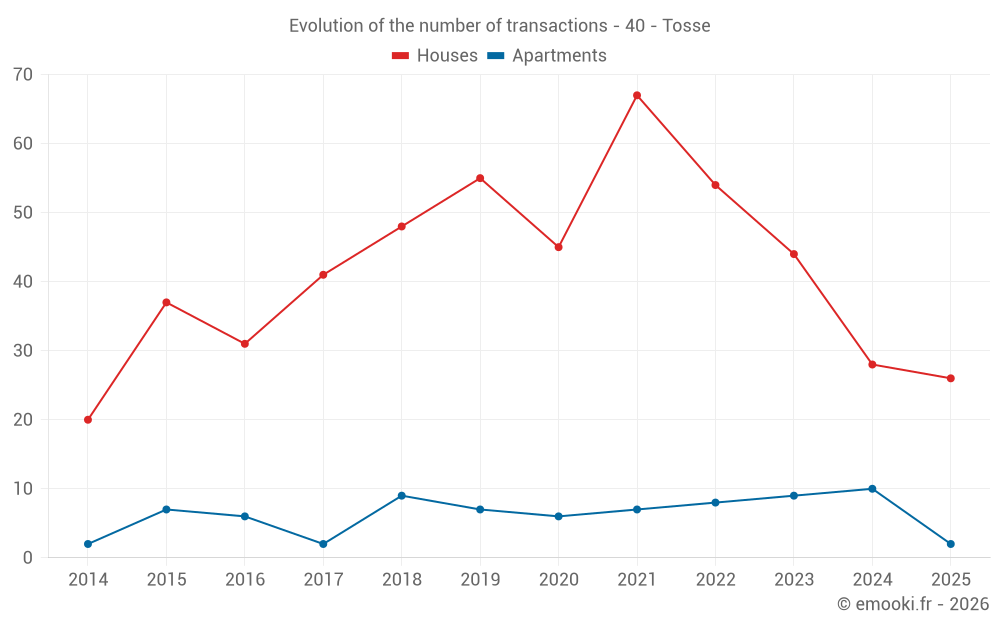
Median price on the 26 transactions of the last 6 months.
from 3 603 to
5 354  /m²
60% of transactions from the 2nd to the 8th deciles.
ApartmentsApartments
4 476  /m²
1-23-45-67-89-10
Reliability 7/10
Median price on the 16 transactions of the last 24 months.
from 4 078 to
5 122  /m²
60% of transactions from the 2nd to the 8th deciles.
DwellingsDwellings
4 399  /m²
1-23-45-67-89-10
Reliability 9/10
Median price on the 28 transactions of the last 6 months.
from 3 421 to
5 202  /m²
60% of transactions from the 2nd to the 8th deciles.
HousesEvolution of the price per m² of houses since...
1 year
-4.8%
2 years
-7.1%
3 years
+4.1%
4 years
+13%
5 years
+33%
6 years
+47%
7 years
+65%
8 years
+86%
9 years
+70%
10 years
+82%
11 years
+84%
The price per m² of houses has decreased by 7.1% since 2 years, but it has increased by 86% in 8 years.

Yearly evolution

Evolution of the median price per m²

Evolution of the median price per m² - 40 - Tosse

Evolution of the number of transactions

Warning, last year incomplete. Projections made based on the proportions between semesters of the previous year at the departmental/national level and by type of property.

Evolution of the number of transactions - 40 - Tosse

Yearly data

Descending order
Year
Houses
house
transactions
Houses
house
Price per m²
Apartments
apt.
transactions
Apartments
apt.
Price per m²
2025
26
4 442 
2
3 714 
2024
28
4 666 
10
4 476 
2023
44
4 780 
9
4 309 
2022
54
4 268 
8
4 202 
2021
67
3 947 
7
3 429 
2020
45
3 340 
6
3 269 
2019
55
3 023 
7
3 131 
2018
48
2 699 
9
2 476 
2017
41
2 393 
2
3 225 
2016
31
2 607 
6
2 549 
2015
37
2 443 
7
2 306 
2014
20
2 418 
2
2 408 

Analysis

Structure of prices per m²

Values of price percentiles per m² over the periods used for the estimated price of each type of property.

Structure of transaction amounts

Values of transaction amounts percentiles over the periods used for the estimated price of each type of property.

Transaction amounts and prices per m² by percentile

Ascending order
Percentile
Houses
house
Price per m²
Houses
house
Transaction amount
Apartments
apt.
Price per m²
Apartments
apt.
Transaction amount
10th percentile
2 822 
271 K
3 254 
202 K
20th percentile
3 603 
310 K
4 078 
210 K
30th percentile
3 856 
359 K
4 218 
222 K
40th percentile
4 231 
400 K
4 417 
230 K
50th percentile
4 442 
415 K
4 476 
237 K
60th percentile
4 711 
466 K
4 762 
260 K
70th percentile
4 884 
492 K
5 032 
261 K
80th percentile
5 354 
528 K
5 122 
265 K
90th percentile
5 496 
665 K
5 236 
297 K

National and departmental comparison

Evolution of the median price per m² of houses

Evolution of the median price per m² of apartments

Quarterly evolution

Evolution of the median price per m²

Evolution of the number of transactions

Quarterly data

Descending order
Quarter
Houses
house
transactions
Houses
house
Price per m²
Apartments
apt.
transactions
Apartments
apt.
Price per m²
2025 Q2
12
4 303 
1
4 128 
2025 Q1
14
4 586 
1
3 299 
2024 Q4
6
5 361 
6
4 476 
2024 Q3
4
4 575 
0
--- 
2024 Q2
9
4 470 
1
3 210 
2024 Q1
9
4 646 
3
4 762 
2023 Q4
12
4 924 
1
5 266 
2023 Q3
6
4 116 
3
5 000 
2023 Q2
9
4 623 
3
3 500 
2023 Q1
17
4 828 
2
3 311 
2022 Q4
17
3 846 
3
4 032 
2022 Q3
10
4 668 
4
4 602 
2022 Q2
15
4 875 
0
--- 
2022 Q1
12
3 804 
1
3 444 
2021 Q4
10
4 318 
1
3 064 
2021 Q3
23
3 867 
2
3 076 
2021 Q2
22
3 880 
3
3 429 
2021 Q1
12
3 794 
1
3 837 
2020 Q4
20
3 424 
2
3 392 
2020 Q3
8
3 788 
0
--- 
2020 Q2
5
3 600 
2
2 846 
2020 Q1
12
3 035 
2
2 933 
2019 Q4
16
3 195 
1
2 711 
2019 Q3
10
2 578 
2
2 354 
2019 Q2
18
3 162 
1
3 209 
2019 Q1
11
3 023 
3
3 156 
2018 Q4
12
2 973 
4
2 398 
2018 Q3
15
2 719 
2
2 775 
2018 Q2
14
2 592 
0
--- 
2018 Q1
7
1 897 
3
2 386 
2017 Q4
12
2 440 
2
3 225 
2017 Q3
8
2 280 
0
--- 
2017 Q2
9
2 821 
0
--- 
2017 Q1
12
2 376 
0
--- 
2016 Q4
8
2 594 
1
2 180 
2016 Q3
7
2 888 
3
2 500 
2016 Q2
11
2 607 
2
2 834 
2016 Q1
5
2 270 
0
--- 
2015 Q4
11
2 599 
1
2 872 
2015 Q3
9
2 789 
3
1 311 
2015 Q2
9
2 434 
3
2 306 
2015 Q1
8
2 268 
0
--- 
2014 Q4
7
2 474 
1
2 676 
2014 Q3
6
2 304 
0
--- 
2014 Q2
3
2 681 
1
2 141 
2014 Q1
4
2 002 
0
--- 

Overview of the latest real estate transactions

The following list is an anonymized overview of the latest transactions. For more details and to find all transactions, please use the map to view transactions by plot or the transaction search page for a search by criteria.

2025-06-30
495 000 
4 231  /m²(117 m²)
Sale
Houses
House
5 rooms
117 m2
Land
607 m2
-Sols
2025-06-06
265 000 
1 906  /m²(139 m²)
Sale
Houses
House
4 rooms
139 m2
Land
562 m2
-Sols
2025-05-28
362 500 
5 577  /m²(65 m²)
Sale
Houses
House
3 rooms
65 m2
1 outbuilding
Land
1009 m2
-Sols
2025-05-28
250 000 
Sale
Land
777 m2
-Terrains à bâtir
2025-05-28
356 000 
3 069  /m²(116 m²)
Sale
Houses
House
4 rooms
116 m2
2 outbuildings
Land
998 m2
-Sols
2025-05-27
227 000 
3 603  /m²(63 m²)
Sale
Houses
House
4 rooms
63 m2
Land
458 m2
-Sols
2025-05-15
160 500 
Sale
2 outbuildings
Land
357 m2
-Sols
2025-05-13
185 000 
Sale
Land
500 m2
-Terrains à bâtir
2025-05-07
1 
Sale
Land
1101 m2
-Terrains à bâtir
2025-05-07
194 000 
4 128  /m²(47 m²)
Sale
Apartments
Apartment
2 rooms
47 m2
3 outbuildings
2025-05-07
400 000 
4 762  /m²(84 m²)
Sale
Houses
House
4 rooms
84 m2
Land
656 m2
-Sols
Land
486 m2
-Sols
2025-05-06
489 700 
4 115  /m²(119 m²)
Sale
Houses
House
5 rooms
119 m2
Land
503 m2
-Sols
2025-05-06
624 005 
4 800  /m²(130 m²)
Sale
Houses
House
5 rooms
130 m2
2 outbuildings
Land
433 m2
-Jardins
Land
800 m2
-Sols
Land
472 m2
-Terres
2025-05-05
295 000 
3 642  /m²(81 m²)
Sale
Houses
House
4 rooms
81 m2
1 outbuilding
2025-05-02
120 000 
Sale
Land
274 m2
-Sols
2025-05-02
300 000 
741  /m²(405 m²)
Sale
Commercial property
405 m2
Land
2465 m2
-Sols
Land
230 m2
-Sols
2025-04-30
403 000 
4 478  /m²(90 m²)
Sale
Houses
House
4 rooms
90 m2
Land
1006 m2
-Sols
2025-04-25
1 
Sale
Land
13149 m2
-Terrains à bâtir
2025-04-25
466 190 
5 359  /m²(87 m²)
Sale
Houses
House
3 rooms
87 m2
4 outbuildings
Land
1033 m2
-Sols
Land
39 m2
-Terrains d'agrément
2025-04-25
402 500 
4 375  /m²(92 m²)
Sale
Houses
House
4 rooms
92 m2
Land
978 m2
-Sols
1261 transactions listed in the municipality

Landes (40)

Most expensive cities

City
name
Descending orderHouses
house
Price per m²
10 244 
6 941 
6 776 
5 777 
4 891 
4 761 
4 725 
4 675 
4 670 
City
name
Descending orderApartments
apt.
Price per m²
8 278 
6 022 
5 835 
4 582 
4 476 
4 261 
4 208 
4 126 
3 985 

Least expensive cities

City
name
Ascending orderHouses
house
Price per m²
596 
776 
819 
825 
828 
886 
886 
City
name
Ascending orderApartments
apt.
Price per m²
222 
392 
431 
500 
510 
556