emooki
HomePrice mapTransactions
🇬🇧 English🇫🇷 Français🇩🇪 Deutsch🇪🇸 Español🇮🇹 Italiano

Real estate price map


Real estate price map in the municipality of Saubion, choose a section to see transactions by parcel.

Landes (40)

Saubion - Real estate price m²

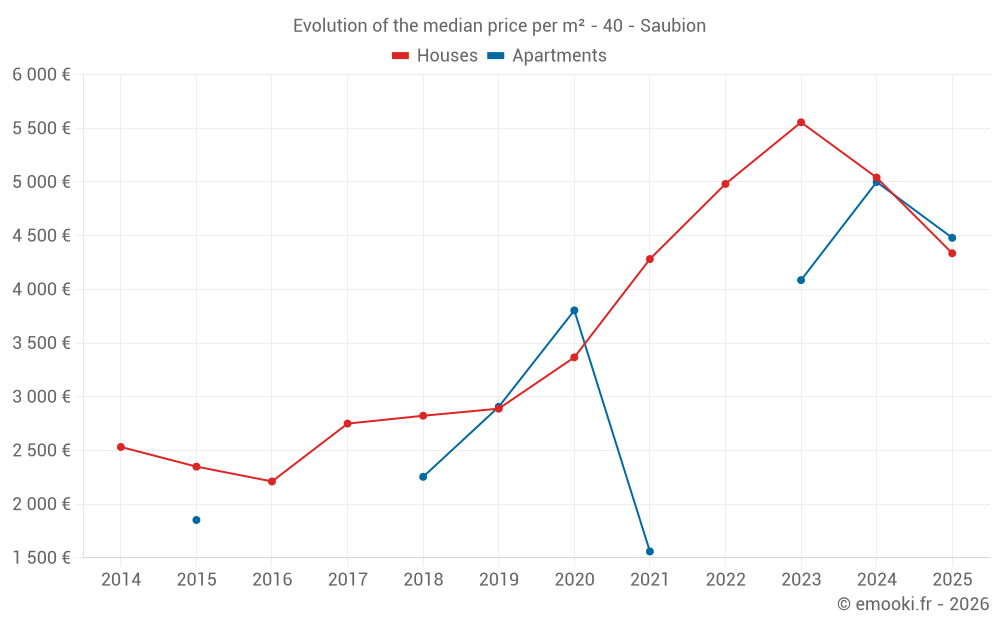
Median price of real estate
in the municipality of Saubion

HousesHouses
4 670  /m²
1-23-45-67-89-10
Reliability 7/10
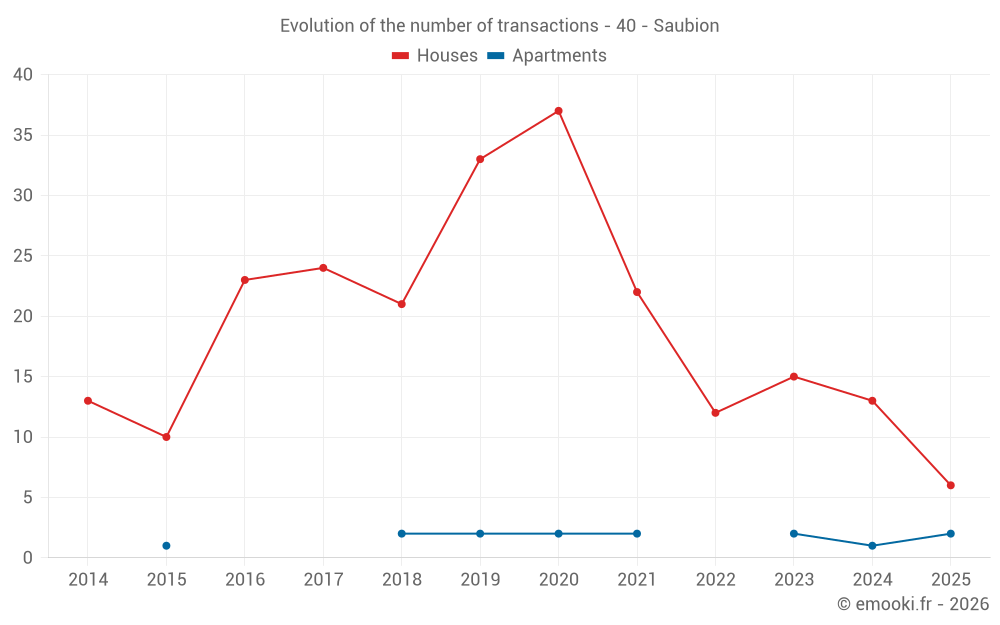
Median price on the 22 transactions of the last 24 months.
from 4 002 to
5 503  /m²
60% of transactions from the 2nd to the 8th deciles.
ApartmentsApartments
3 985  /m²
1-23-45-67-89-10
Reliability 4/10
Median price on the 9 transactions of the last 60 months.
DwellingsDwellings
4 743  /m²
1-23-45-67-89-10
Reliability 8/10
Median price on the 17 transactions of the last 12 months.
from 4 117 to
5 117  /m²
60% of transactions from the 2nd to the 8th deciles.
HousesEvolution of the price per m² of houses since...
1 year
-14%
2 years
-22%
3 years
-13%
4 years
+1.3%
5 years
+29%
6 years
+50%
7 years
+54%
8 years
+58%
9 years
+96%
10 years
+85%
11 years
+71%
The price per m² of houses has decreased by 22% since 2 years, but it has increased by 96% in 9 years.

Yearly evolution

Evolution of the median price per m²

Evolution of the median price per m² - 40 - Saubion

Evolution of the number of transactions

Warning, last year incomplete. Projections made based on the proportions between semesters of the previous year at the departmental/national level and by type of property.

Evolution of the number of transactions - 40 - Saubion

Yearly data

Descending order
Year
Houses
house
transactions
Houses
house
Price per m²
Apartments
apt.
transactions
Apartments
apt.
Price per m²
2025
6
4 336 
2
4 480 
2024
13
5 041 
1
5 000 
2023
15
5 556 
2
4 086 
2022
12
4 982 
0
--- 
2021
22
4 282 
2
1 559 
2020
37
3 367 
2
3 804 
2019
33
2 889 
2
2 906 
2018
21
2 823 
2
2 254 
2017
24
2 750 
0
--- 
2016
23
2 211 
0
--- 
2015
10
2 349 
1
1 852 
2014
13
2 532 
0
--- 

Analysis

Structure of prices per m²

Values of price percentiles per m² over the periods used for the estimated price of each type of property.

Structure of transaction amounts

Values of transaction amounts percentiles over the periods used for the estimated price of each type of property.

Transaction amounts and prices per m² by percentile

Ascending order
Percentile
Houses
house
Price per m²
Houses
house
Transaction amount
Apartments
apt.
Price per m²
Apartments
apt.
Transaction amount
10th percentile
3 768 
307 K
2 384 
131 K
20th percentile
4 002 
340 K
3 431 
171 K
30th percentile
4 244 
357 K
3 796 
215 K
40th percentile
4 445 
385 K
3 874 
269 K
50th percentile
4 670 
429 K
3 985 
271 K
60th percentile
4 982 
446 K
4 070 
282 K
70th percentile
5 115 
493 K
4 149 
301 K
80th percentile
5 503 
577 K
4 461 
321 K
90th percentile
5 818 
982 K
4 896 
341 K

National and departmental comparison

Evolution of the median price per m² of houses

Evolution of the median price per m² of apartments

Quarterly evolution

Evolution of the median price per m²

Evolution of the number of transactions

Quarterly data

Descending order
Quarter
Houses
house
transactions
Houses
house
Price per m²
Apartments
apt.
transactions
Apartments
apt.
Price per m²
2025 Q2
2
4 336 
1
4 091 
2025 Q1
4
4 408 
1
4 870 
2024 Q4
3
4 743 
1
5 000 
2024 Q3
5
5 122 
0
--- 
2024 Q2
2
5 696 
0
--- 
2024 Q1
3
3 743 
0
--- 
2023 Q4
1
3 991 
2
4 086 
2023 Q3
2
5 452 
0
--- 
2023 Q2
6
6 027 
0
--- 
2023 Q1
6
5 278 
0
--- 
2022 Q4
2
4 816 
0
--- 
2022 Q3
5
5 558 
0
--- 
2022 Q2
3
5 263 
0
--- 
2022 Q1
2
2 461 
0
--- 
2021 Q4
5
3 563 
1
184 
2021 Q3
7
4 607 
0
--- 
2021 Q2
6
4 014 
0
--- 
2021 Q1
4
5 020 
1
2 934 
2020 Q4
15
3 531 
1
3 846 
2020 Q3
9
3 458 
1
3 762 
2020 Q2
7
2 853 
0
--- 
2020 Q1
6
3 288 
0
--- 
2019 Q4
7
3 434 
1
2 784 
2019 Q3
10
2 553 
1
3 029 
2019 Q2
11
2 889 
0
--- 
2019 Q1
5
2 838 
0
--- 
2018 Q4
4
2 946 
0
--- 
2018 Q3
6
3 482 
1
2 583 
2018 Q2
5
3 165 
1
1 926 
2018 Q1
6
2 365 
0
--- 
2017 Q4
4
3 088 
0
--- 
2017 Q3
6
2 750 
0
--- 
2017 Q2
7
2 589 
0
--- 
2017 Q1
7
2 924 
0
--- 
2016 Q4
8
1 773 
0
--- 
2016 Q3
6
2 713 
0
--- 
2016 Q2
5
2 211 
0
--- 
2016 Q1
4
2 044 
0
--- 
2015 Q4
4
2 588 
0
--- 
2015 Q3
2
1 703 
0
--- 
2015 Q2
3
1 933 
1
1 852 
2015 Q1
1
3 344 
0
--- 
2014 Q4
5
2 655 
0
--- 
2014 Q3
4
2 724 
0
--- 
2014 Q2
3
2 532 
0
--- 
2014 Q1
1
2 045 
0
--- 

Overview of the latest real estate transactions

The following list is an anonymized overview of the latest transactions. For more details and to find all transactions, please use the map to view transactions by plot or the transaction search page for a search by criteria.

2025-05-13
415 362 
4 372  /m²(95 m²)
Sale
Houses
House
4 rooms
95 m2
1 outbuilding
Land
741 m2
-Sols
2025-04-29
365 385 
4 299  /m²(85 m²)
Sale
Houses
House
4 rooms
85 m2
Land
743 m2
-Sols
2025-04-16
360 000 
4 091  /m²(88 m²)
Sale
Apartments
Apartment
3 rooms
88 m2
3 outbuildings
2025-03-27
340 000 
4 048  /m²(84 m²)
Sale
Houses
House
4 rooms
84 m2
Land
381 m2
-Sols
2025-03-27
1 
Exchange
Land
59 m2
-Terres
Land
126 m2
-Terres
2025-03-17
460 000 
4 423  /m²(104 m²)
Sale
Houses
House
3 rooms
104 m2
Land
3282 m2
-Sols
Land
12350 m2
-Taillis simples
Land
5600 m2
-Taillis simples
Land
8474 m2
-Eaux
Land
280 m2
-Taillis simples
2025-03-14
325 000 
4 221  /m²(77 m²)
Sale
Houses
House
4 rooms
77 m2
Land
479 m2
-Sols
2025-02-11
8 500 
Sale
Land
95 m2
-Futaies résineuses
/Pins
Land
756 m2
-Futaies résineuses
/Pins
Land
2125 m2
-Futaies résineuses
/Pins
2025-01-22
436 580 
4 596  /m²(95 m²)
Sale
Houses
House
5 rooms
95 m2
2 outbuildings
Land
847 m2
-Sols
2025-01-17
336 000 
4 870  /m²(69 m²)
Sale
Apartments
Apartment
3 rooms
69 m2
2 outbuildings
2025-01-07
520 000 
5 098  /m²(102 m²)
Sale
Houses
House
4 rooms
102 m2
1 outbuilding
Land
1163 m2
-Terrains d'agrément
Land
1000 m2
-Sols
Land
579 m2
-Landes
2024-11-28
341 500 
4 743  /m²(72 m²)
Sale
Houses
House
4 rooms
72 m2
Land
263 m2
-Sols
Land
55 m2
-Terrains d'agrément
Land
419 m2
-Terrains d'agrément
2024-11-18
1 088 100 
8 775  /m²(124 m²)
Sale
Houses
House
4 rooms
124 m2
2 outbuildings
Land
634 m2
-Sols
Land
126 m2
-Terrains d'agrément
Land
35 m2
-Terrains d'agrément
Land
172 m2
-Terrains d'agrément
Land
1036 m2
-Taillis simples
Land
301 m2
-Taillis simples
Land
63 m2
-Taillis simples
2024-10-17
292 500 
3 703  /m²(79 m²)
Sale
Houses
House
4 rooms
79 m2
Land
638 m2
-Sols
2024-10-01
285 000 
5 000  /m²(57 m²)
Sale
Apartments
Apartment
3 rooms
57 m2
2 outbuildings
2024-09-03
580 000 
567  /m²(1023 m²)
Sale
Commercial property
1023 m2
Land
1711 m2
-Sols
Land
98 m2
-Sols
2024-08-26
355 000 
3 989  /m²(89 m²)
Sale
Houses
House
4 rooms
89 m2
Land
300 m2
-Sols
2024-07-29
54 000 
Sale
Land
66520 m2
-Futaies résineuses
/Pins
2024-07-19
363 000 
5 418  /m²(67 m²)
Sale
Houses
House
3 rooms
67 m2
Land
371 m2
-Sols
2024-07-16
453 000 
5 524  /m²(82 m²)
Sale
Houses
House
4 rooms
82 m2
Land
633 m2
-Sols
Land
30 m2
-Sols
562 transactions listed in the municipality

Landes (40)

Most expensive cities

City
name
Descending orderHouses
house
Price per m²
10 244 
6 941 
6 776 
5 777 
4 891 
4 761 
4 725 
4 675 
4 670 
City
name
Descending orderApartments
apt.
Price per m²
8 278 
6 022 
5 835 
4 582 
4 476 
4 261 
4 208 
4 126 
3 985 

Least expensive cities

City
name
Ascending orderHouses
house
Price per m²
596 
776 
819 
825 
828 
886 
886 
City
name
Ascending orderApartments
apt.
Price per m²
222 
392 
431 
500 
510 
556