emooki
HomePrice mapTransactions
🇬🇧 English🇫🇷 Français🇩🇪 Deutsch🇪🇸 Español🇮🇹 Italiano

Real estate price map


Real estate price map in the municipality of Vieux-Boucau-les-Bains, choose a section to see transactions by parcel.

Landes (40)

Vieux-Boucau-les-Bains - Real estate price m²

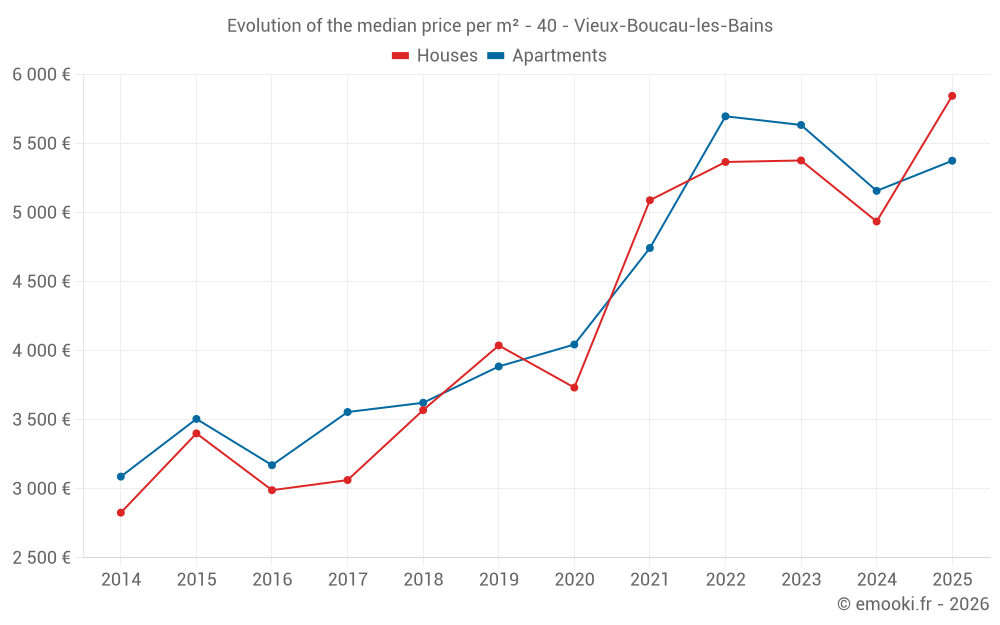
Median price of real estate
in the municipality of Vieux-Boucau-les-Bains

HousesHouses
5 110  /m²
1-23-45-67-89-10
Reliability 8/10
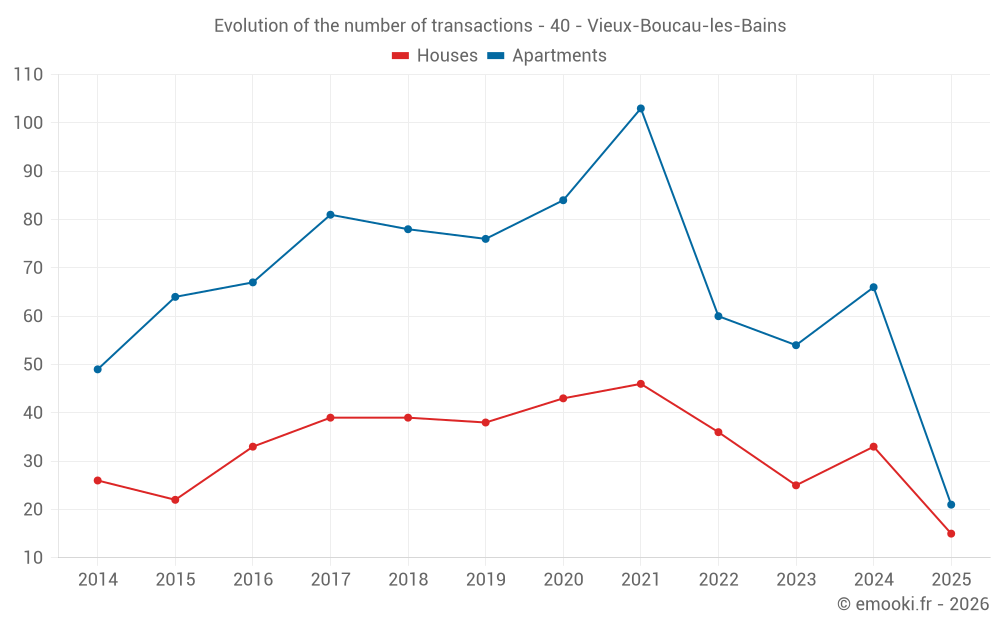
Median price on the 36 transactions of the last 12 months.
from 3 490 to
6 763  /m²
60% of transactions from the 2nd to the 8th deciles.
ApartmentsApartments
5 376  /m²
1-23-45-67-89-10
Reliability 9/10
Median price on the 21 transactions of the last 6 months.
from 4 648 to
6 400  /m²
60% of transactions from the 2nd to the 8th deciles.
DwellingsDwellings
5 421  /m²
1-23-45-67-89-10
Reliability 9/10
Median price on the 36 transactions of the last 6 months.
from 4 456 to
6 481  /m²
60% of transactions from the 2nd to the 8th deciles.
HousesEvolution of the price per m² of houses since...
1 year
+18%
2 years
+8.7%
3 years
+8.9%
4 years
+15%
5 years
+57%
6 years
+45%
7 years
+64%
8 years
+91%
9 years
+96%
10 years
+72%
11 years
+107%
ApartmentsEvolution of the price per m² of apartments since...
1 year
+4.2%
2 years
-4.6%
3 years
-5.7%
4 years
+13%
5 years
+33%
6 years
+38%
7 years
+48%
8 years
+51%
9 years
+70%
10 years
+53%
11 years
+74%
The price per m² of apartments has decreased by 5.7% since 3 years, but it has increased by 74% in 11 years.

Yearly evolution

Evolution of the median price per m²

Evolution of the median price per m² - 40 - Vieux-Boucau-les-Bains

Evolution of the number of transactions

Warning, last year incomplete. Projections made based on the proportions between semesters of the previous year at the departmental/national level and by type of property.

Evolution of the number of transactions - 40 - Vieux-Boucau-les-Bains

Yearly data

Descending order
Year
Houses
house
transactions
Houses
house
Price per m²
Apartments
apt.
transactions
Apartments
apt.
Price per m²
2025
15
5 846 
21
5 376 
2024
33
4 936 
66
5 158 
2023
25
5 378 
54
5 635 
2022
36
5 367 
60
5 698 
2021
46
5 090 
103
4 744 
2020
43
3 733 
84
4 045 
2019
38
4 038 
76
3 886 
2018
39
3 570 
78
3 623 
2017
39
3 063 
81
3 556 
2016
33
2 990 
67
3 171 
2015
22
3 401 
64
3 506 
2014
26
2 827 
49
3 088 

Analysis

Structure of prices per m²

Values of price percentiles per m² over the periods used for the estimated price of each type of property.

Structure of transaction amounts

Values of transaction amounts percentiles over the periods used for the estimated price of each type of property.

Transaction amounts and prices per m² by percentile

Ascending order
Percentile
Houses
house
Price per m²
Houses
house
Transaction amount
Apartments
apt.
Price per m²
Apartments
apt.
Transaction amount
10th percentile
2 678 
167 K
4 456 
149 K
20th percentile
3 490 
228 K
4 648 
165 K
30th percentile
4 187 
266 K
4 967 
182 K
40th percentile
4 443 
350 K
5 056 
204 K
50th percentile
5 110 
397 K
5 376 
215 K
60th percentile
5 946 
412 K
5 580 
223 K
70th percentile
6 340 
448 K
5 816 
255 K
80th percentile
6 763 
532 K
6 400 
261 K
90th percentile
7 350 
602 K
6 865 
312 K

National and departmental comparison

Evolution of the median price per m² of houses

Evolution of the median price per m² of apartments

Quarterly evolution

Evolution of the median price per m²

Evolution of the number of transactions

Quarterly data

Descending order
Quarter
Houses
house
transactions
Houses
house
Price per m²
Apartments
apt.
transactions
Apartments
apt.
Price per m²
2025 Q2
5
5 846 
10
5 343 
2025 Q1
10
5 520 
11
5 466 
2024 Q4
9
5 946 
19
5 000 
2024 Q3
12
4 512 
15
4 569 
2024 Q2
8
4 498 
16
5 702 
2024 Q1
4
5 109 
16
5 563 
2023 Q4
7
5 196 
9
5 635 
2023 Q3
5
7 383 
11
5 486 
2023 Q2
7
5 663 
15
5 868 
2023 Q1
6
5 247 
19
5 488 
2022 Q4
2
7 086 
18
5 723 
2022 Q3
7
4 550 
10
5 266 
2022 Q2
14
5 599 
12
6 186 
2022 Q1
13
4 839 
20
5 458 
2021 Q4
13
5 594 
28
5 246 
2021 Q3
12
5 406 
19
4 850 
2021 Q2
10
4 650 
28
4 684 
2021 Q1
11
4 296 
28
4 326 
2020 Q4
12
3 975 
27
4 444 
2020 Q3
11
3 711 
23
3 714 
2020 Q2
13
3 739 
16
3 942 
2020 Q1
7
3 061 
18
3 781 
2019 Q4
16
4 186 
22
4 072 
2019 Q3
5
3 567 
19
3 850 
2019 Q2
9
3 899 
15
4 129 
2019 Q1
8
4 212 
20
3 736 
2018 Q4
10
3 398 
19
3 484 
2018 Q3
10
3 471 
26
3 844 
2018 Q2
8
3 552 
16
3 806 
2018 Q1
11
3 889 
17
3 640 
2017 Q4
13
3 000 
15
3 574 
2017 Q3
9
3 063 
16
3 356 
2017 Q2
12
2 986 
28
3 639 
2017 Q1
5
3 348 
22
3 452 
2016 Q4
15
2 990 
20
3 055 
2016 Q3
9
3 073 
12
3 235 
2016 Q2
6
3 096 
13
3 417 
2016 Q1
3
2 593 
22
3 128 
2015 Q4
7
3 359 
17
3 633 
2015 Q3
6
3 566 
25
3 250 
2015 Q2
7
3 312 
16
3 456 
2015 Q1
2
1 428 
6
2 767 
2014 Q4
8
3 168 
21
3 195 
2014 Q3
7
2 896 
10
2 696 
2014 Q2
4
2 828 
8
2 925 
2014 Q1
7
2 179 
10
3 132 

Overview of the latest real estate transactions

The following list is an anonymized overview of the latest transactions. For more details and to find all transactions, please use the map to view transactions by plot or the transaction search page for a search by criteria.

2025-06-27
10 000 
Sale
2 outbuildings
2025-06-16
255 000 
5 795  /m²(44 m²)
Sale
Apartments
Apartment
3 rooms
44 m2
Land
18 m2
-Sols
Land
38 m2
-Sols
2025-06-13
228 000 
5 846  /m²(39 m²)
Sale
1 outbuilding
Houses
House
3 rooms
39 m2
2025-05-30
260 000 
7 222  /m²(36 m²)
Sale
Apartments
Apartment
1 room
36 m2
1 outbuilding
2025-05-28
260 870 
6 865  /m²(38 m²)
Sale
Apartments
Apartment
2 rooms
38 m2
1 outbuilding
2025-05-28
312 470 
5 580  /m²(56 m²)
Sale
Apartments
Apartment
3 rooms
56 m2
2 outbuildings
2025-05-28
149 000 
3 725  /m²(40 m²)
Sale
Apartments
Apartment
2 rooms
40 m2
2025-05-28
223 100 
4 648  /m²(48 m²)
Sale
Apartments
Apartment
2 rooms
48 m2
2025-05-27
768 800 
6 302  /m²(122 m²)
Sale
Houses
House
5 rooms
122 m2
1 outbuilding
Land
507 m2
-Sols
2025-05-27
204 306 
5 376  /m²(38 m²)
Sale
Apartments
Apartment
2 rooms
38 m2
1 outbuilding
2025-05-26
164 617 
5 310  /m²(31 m²)
Sale
Apartments
Apartment
2 rooms
31 m2
2025-05-22
213 900 
4 456  /m²(48 m²)
Sale
Apartments
Apartment
2 rooms
48 m2
2025-05-21
25 000 
Sale
1 outbuilding
2025-05-06
335 000 
3 490  /m²(96 m²)
Sale
Houses
House
3 rooms
72 m2
Houses
House
1 room
24 m2
Land
314 m2
-Sols
2025-04-30
360 000 
7 200  /m²(50 m²)
Sale
Houses
House
3 rooms
50 m2
Land
733 m2
-Sols
2025-04-28
182 000 
5 056  /m²(36 m²)
Sale
Apartments
Apartment
2 rooms
36 m2
1 outbuilding
2025-04-08
395 000 
2 469  /m²(160 m²)
Sale
Houses
House
5 rooms
90 m2
Houses
House
2 rooms
70 m2
Land
639 m2
-Sols
2025-03-31
234 000 
6 000  /m²(39 m²)
Sale
Apartments
Apartment
3 rooms
39 m2
1 outbuilding
2025-03-31
342 450 
7 134  /m²(48 m²)
Sale
1 outbuilding
1 outbuilding
Apartments
Apartment
3 rooms
48 m2
1 outbuilding
2025-03-27
149 000 
4 967  /m²(30 m²)
Sale
Apartments
Apartment
2 rooms
30 m2
1 outbuilding
1634 transactions listed in the municipality

Landes (40)

Most expensive cities

City
name
Descending orderHouses
house
Price per m²
10 244 
6 941 
6 776 
5 777 
4 891 
4 761 
4 725 
4 675 
4 670 
City
name
Descending orderApartments
apt.
Price per m²
8 278 
6 022 
5 835 
4 582 
4 476 
4 261 
4 208 
4 126 
3 985 

Least expensive cities

City
name
Ascending orderHouses
house
Price per m²
596 
776 
819 
825 
828 
886 
886 
City
name
Ascending orderApartments
apt.
Price per m²
222 
392 
431 
500 
510 
556