Median price of real estate
in the municipality of Azur
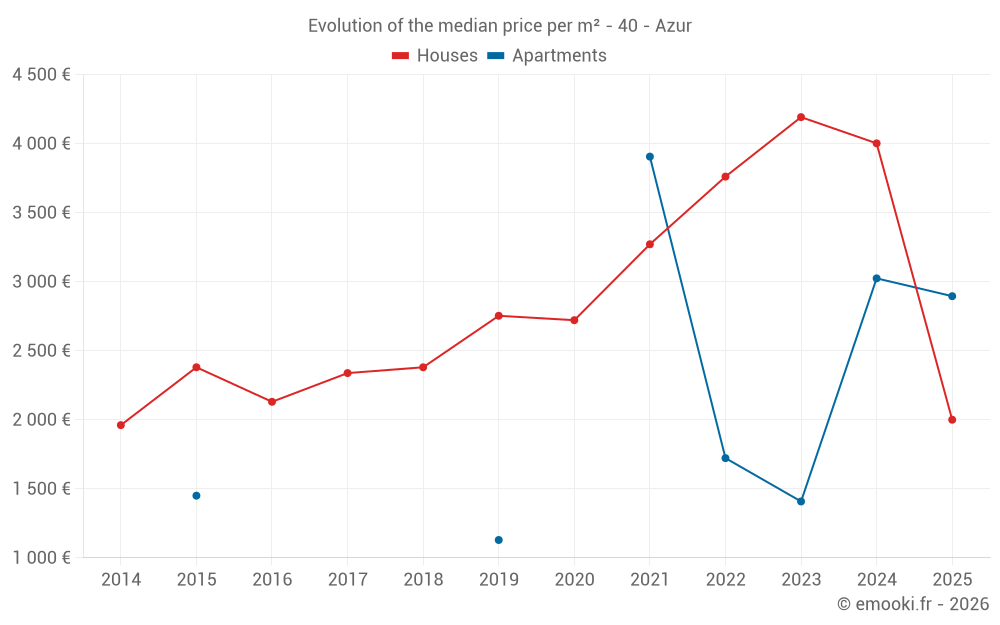
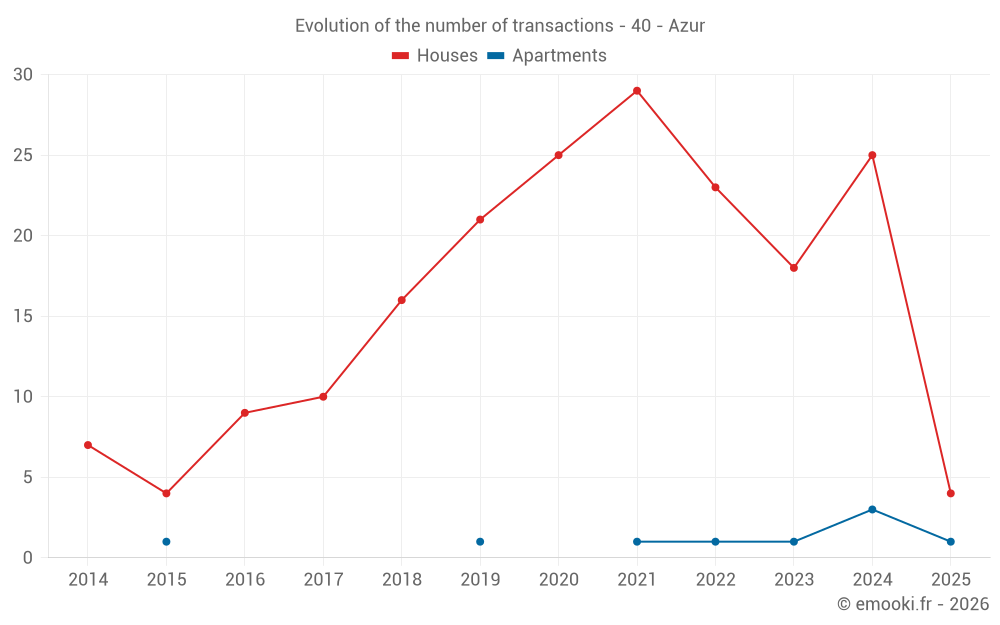
Houses
3 759 € /m²
Reliability 8/10
Median price on the 19 transactions of the last 12 months.
from 2 444 to
4 821 € /m²
4 821 € /m²
60% of transactions from the 2nd to the 8th deciles.
Apartments
2 895 € /m²
Reliability 3/10
Median price on the 7 transactions of the last 72 months.
Dwellings
3 608 € /m²
Reliability 8/10
Median price on the 23 transactions of the last 12 months.
from 2 383 to
4 663 € /m²
4 663 € /m²
60% of transactions from the 2nd to the 8th deciles.