emooki
HomePrice mapTransactions
🇬🇧 English🇫🇷 Français🇩🇪 Deutsch🇪🇸 Español🇮🇹 Italiano

Real estate price map


Real estate price map in the municipality of Brié-et-Angonnes, choose a section to see transactions by parcel.

Isère (38)
Brié-et-Angonnes

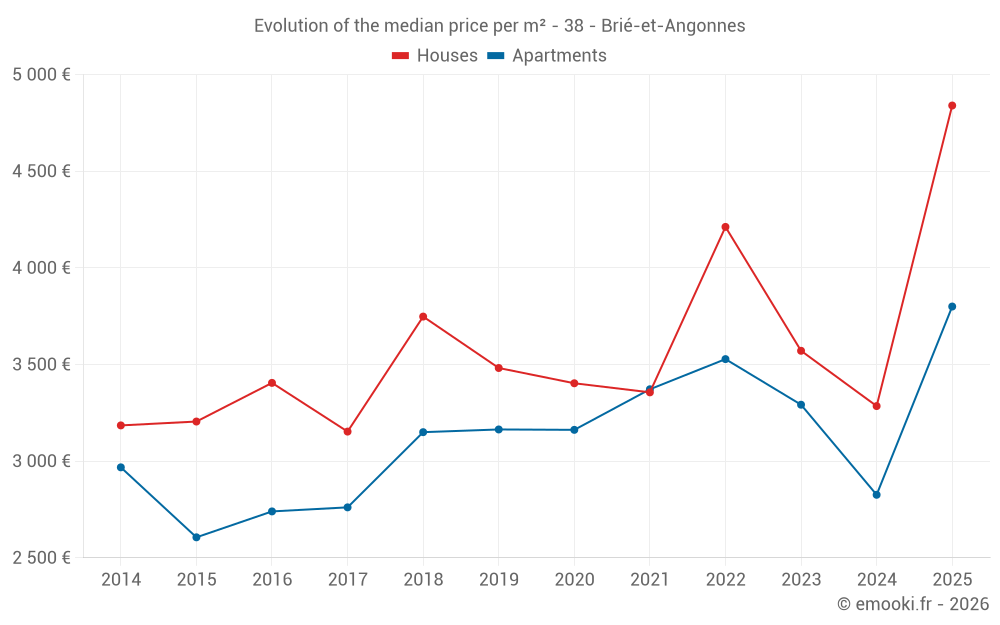
Median price of real estate
in the municipality of Brié-et-Angonnes

HousesHouses
3 659  /m²
1-23-45-67-89-10
Reliability 7/10
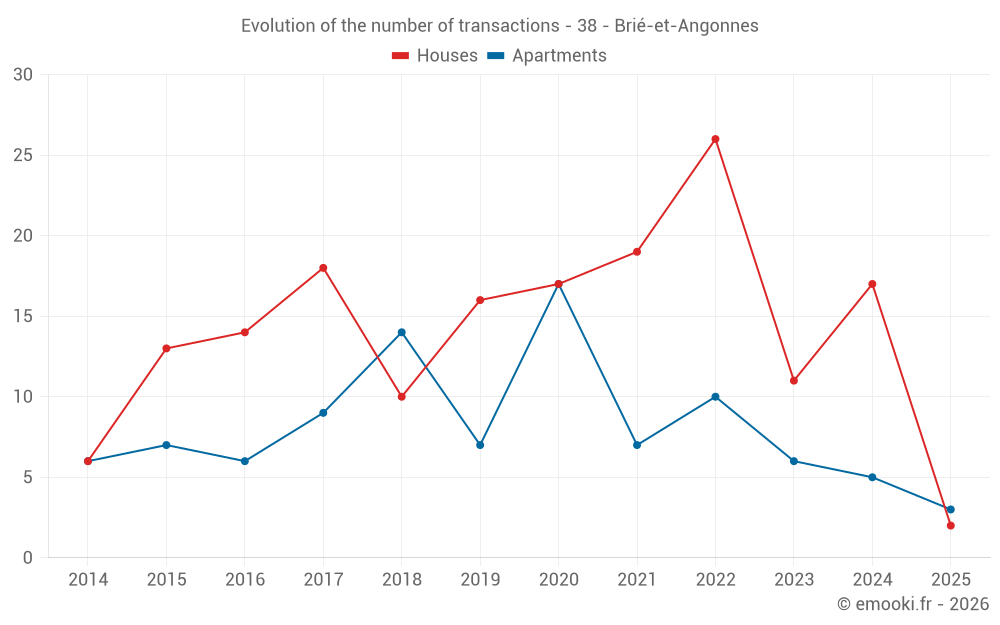
Median price on the 25 transactions of the last 24 months.
from 2 913 to
4 634  /m²
60% of transactions from the 2nd to the 8th deciles.
ApartmentsApartments
3 478  /m²
1-23-45-67-89-10
Reliability 6/10
Median price on the 19 transactions of the last 36 months.
from 2 777 to
3 834  /m²
60% of transactions from the 2nd to the 8th deciles.
DwellingsDwellings
3 659  /m²
1-23-45-67-89-10
Reliability 8/10
Median price on the 17 transactions of the last 12 months.
from 2 916 to
4 311  /m²
60% of transactions from the 2nd to the 8th deciles.

Yearly evolution

Evolution of the median price per m²

Evolution of the number of transactions

Warning, last year incomplete. Projections made based on the proportions between semesters of the previous year at the departmental/national level and by type of property.

Yearly data

Descending order
Year
Houses
house
transactions
Houses
house
Price per m²
Apartments
apt.
transactions
Apartments
apt.
Price per m²
2025
2
4 840 
3
3 800 
2024
17
3 285 
5
2 826 
2023
11
3 571 
6
3 292 
2022
26
4 212 
10
3 528 
2021
19
3 356 
7
3 372 
2020
17
3 403 
17
3 162 
2019
16
3 482 
7
3 164 
2018
10
3 748 
14
3 150 
2017
18
3 153 
9
2 761 
2016
14
3 405 
6
2 740 
2015
13
3 205 
7
2 606 
2014
6
3 185 
6
2 968 

Analysis

Structure of prices per m²

Values of price percentiles per m² over the periods used for the estimated price of each type of property.

Structure of transaction amounts

Values of transaction amounts percentiles over the periods used for the estimated price of each type of property.

Transaction amounts and prices per m² by percentile

Ascending order
Percentile
Houses
house
Price per m²
Houses
house
Transaction amount
Apartments
apt.
Price per m²
Apartments
apt.
Transaction amount
10th percentile
2 753 
248 K
2 364 
178 K
20th percentile
2 913 
334 K
2 777 
193 K
30th percentile
3 145 
375 K
2 964 
210 K
40th percentile
3 240 
432 K
3 386 
224 K
50th percentile
3 659 
455 K
3 478 
242 K
60th percentile
4 149 
509 K
3 665 
267 K
70th percentile
4 362 
625 K
3 719 
292 K
80th percentile
4 634 
684 K
3 834 
304 K
90th percentile
5 069 
827 K
4 107 
349 K

National and departmental comparison

Evolution of the median price per m² of houses

Evolution of the median price per m² of apartments

Quarterly evolution

Evolution of the median price per m²

Evolution of the number of transactions

Quarterly data

Descending order
Quarter
Houses
house
transactions
Houses
house
Price per m²
Apartments
apt.
transactions
Apartments
apt.
Price per m²
2025 Q2
0
--- 
1
3 800 
2025 Q1
2
4 840 
2
3 910 
2024 Q4
5
3 173 
1
2 826 
2024 Q3
4
4 216 
2
2 552 
2024 Q2
4
4 098 
1
2 869 
2024 Q1
4
3 028 
1
3 679 
2023 Q4
3
2 917 
3
3 478 
2023 Q3
3
4 270 
1
3 723 
2023 Q2
3
2 797 
1
3 106 
2023 Q1
2
3 434 
1
1 511 
2022 Q4
1
1 961 
3
3 444 
2022 Q3
6
4 428 
2
4 096 
2022 Q2
14
4 333 
3
3 659 
2022 Q1
5
3 817 
2
2 486 
2021 Q4
1
6 082 
2
3 878 
2021 Q3
10
3 800 
2
2 744 
2021 Q2
4
3 666 
1
1 393 
2021 Q1
4
2 796 
2
3 362 
2020 Q4
8
3 444 
1
3 762 
2020 Q3
2
3 798 
4
2 526 
2020 Q2
4
2 532 
6
3 085 
2020 Q1
3
3 879 
6
3 233 
2019 Q4
2
3 830 
3
3 338 
2019 Q3
4
3 431 
1
4 019 
2019 Q2
7
2 347 
2
3 150 
2019 Q1
3
3 381 
1
2 395 
2018 Q4
4
3 082 
5
3 169 
2018 Q3
0
--- 
2
2 966 
2018 Q2
4
4 237 
4
3 215 
2018 Q1
2
3 024 
3
3 188 
2017 Q4
3
3 477 
3
3 295 
2017 Q3
0
--- 
2
3 006 
2017 Q2
9
3 920 
3
2 761 
2017 Q1
6
2 905 
1
2 514 
2016 Q4
6
2 941 
1
3 331 
2016 Q3
1
3 296 
1
3 132 
2016 Q2
4
3 908 
4
2 342 
2016 Q1
3
3 815 
0
--- 
2015 Q4
5
3 304 
0
--- 
2015 Q3
4
3 080 
2
2 477 
2015 Q2
2
3 078 
4
2 603 
2015 Q1
2
3 249 
1
3 107 
2014 Q4
2
2 498 
3
2 929 
2014 Q3
1
3 273 
0
--- 
2014 Q2
2
3 308 
3
3 006 
2014 Q1
1
4 219 
0
--- 

Overview of the latest real estate transactions

The following list is an anonymized overview of the latest transactions. For more details and to find all transactions, please use the map to view transactions by plot or the transaction search page for a search by criteria.

2025-06-16
275 000 
Sale
Land
579 m2
-Sols
Land
331 m2
-Terrains à bâtir
2025-04-23
147 500 
Sale
Land
1056 m2
-Terrains d'agrément
/Parc
2025-04-17
190 000 
3 800  /m²(50 m²)
Sale
Apartments
Apartment
2 rooms
50 m2
1 outbuilding
2025-04-17
147 500 
Sale
Land
1109 m2
-Terrains d'agrément
/Parc
2025-04-16
188 000 
Sale
Land
512 m2
-Terrains à bâtir
2025-04-15
1 
Sale
Land
38 m2
-Sols
2025-04-04
250 000 
Sale
1 outbuilding
Land
843 m2
-Terrains d'agrément
/Parc
Land
100 m2
-Sols
2025-03-31
260 000 
3 714  /m²(70 m²)
Sale
Apartments
Apartment
3 rooms
70 m2
3 outbuildings
2025-02-28
300 
Exchange
Land
4 m2
-Sols
Land
30 m2
-Sols
Land
14 m2
-Sols
Land
11 m2
-Sols
2025-02-20
240 000 
245  /m²(981 m²)
Sale
Commercial property
981 m2
Commercial property
Land
3665 m2
-Sols
2025-02-11
450 000 
3 659  /m²(123 m²)
Sale
Houses
House
4 rooms
123 m2
Land
1359 m2
-Sols
2025-02-07
349 000 
4 106  /m²(85 m²)
Sale
Apartments
Apartment
4 rooms
85 m2
2 outbuildings
2025-02-05
517 800 
6 021  /m²(86 m²)
Sale
Houses
House
4 rooms
86 m2
Land
468 m2
-Terrains d'agrément
/Parc
Land
1000 m2
-Sols
Land
599 m2
-Sols
2025-01-21
15 000 
Sale
Land
3431 m2
-Prés
2025-01-21
170 000 
Sale
Land
713 m2
-Sols
Land
833 m2
-Terrains à bâtir
2024-12-30
200 000 
Sale
2 outbuildings
Land
756 m2
-Sols
Land
9 m2
-Sols
Land
49 m2
-Sols
Land
35 m2
-Sols
2024-12-30
209 100 
2 826  /m²(74 m²)
Sale
Apartments
Apartment
3 rooms
74 m2
2 outbuildings
2024-12-30
38 400 
Exchange
Land
384 m2
-Terrains d'agrément
/Parc
2024-12-30
21 100 
Exchange
Land
211 m2
-Sols
2024-12-30
680 000 
3 285  /m²(207 m²)
Sale
Houses
House
4 rooms
207 m2
1 outbuilding
Land
320 m2
-Terrains d'agrément
/Parc
Land
1000 m2
-Sols
Land
384 m2
-Terrains d'agrément
/Parc
Land
72 m2
-Terrains d'agrément
/Parc
465 transactions listed in the municipality

Isère (38)

Most expensive cities

City
name
Descending orderHouses
house
Price per m²
8 262 
4 917 
4 777 
4 663 
4 610 
4 575 
4 506 
City
name
Descending orderApartments
apt.
Price per m²
7 647 
6 370 
5 636 
4 866 
4 524 
4 492 
4 249 
4 234 
3 958 

Least expensive cities

City
name
Ascending orderHouses
house
Price per m²
502 
722 
975 
1 133 
1 198 
1 237 
City
name
Ascending orderApartments
apt.
Price per m²
475 
483 
541 
562