emooki
HomePrice mapTransactions
🇬🇧 English🇫🇷 Français🇩🇪 Deutsch🇪🇸 Español🇮🇹 Italiano

Real estate price map


Real estate price map in the municipality of Saint-Nizier-du-Moucherotte, choose a section to see transactions by parcel.

Isère (38)

Saint-Nizier-du-Moucherotte - Real estate price m²

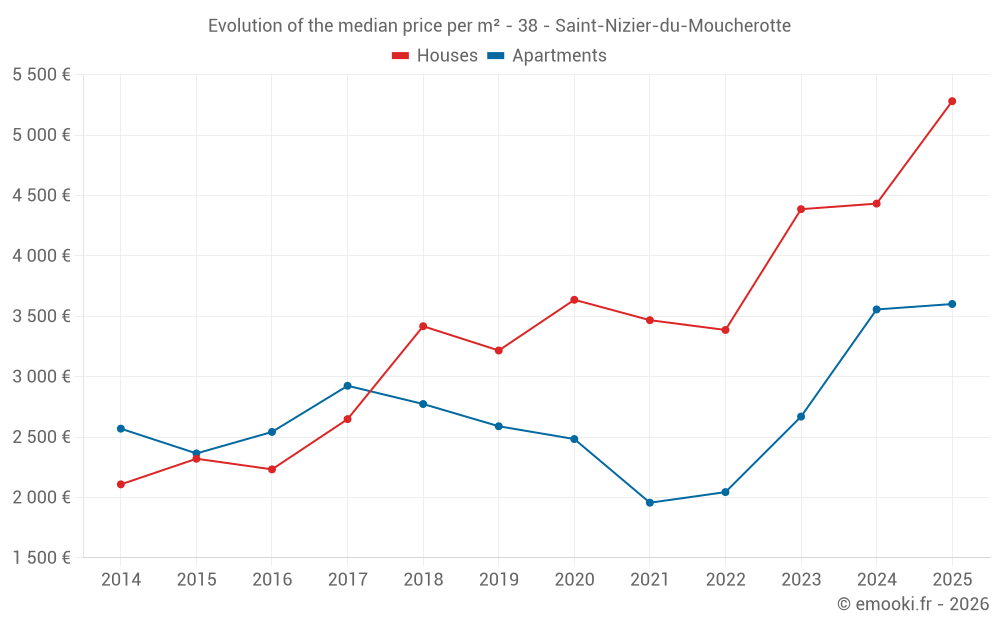
Median price of real estate
in the municipality of Saint-Nizier-du-Moucherotte

HousesHouses
4 516  /m²
1-23-45-67-89-10
Reliability 6/10
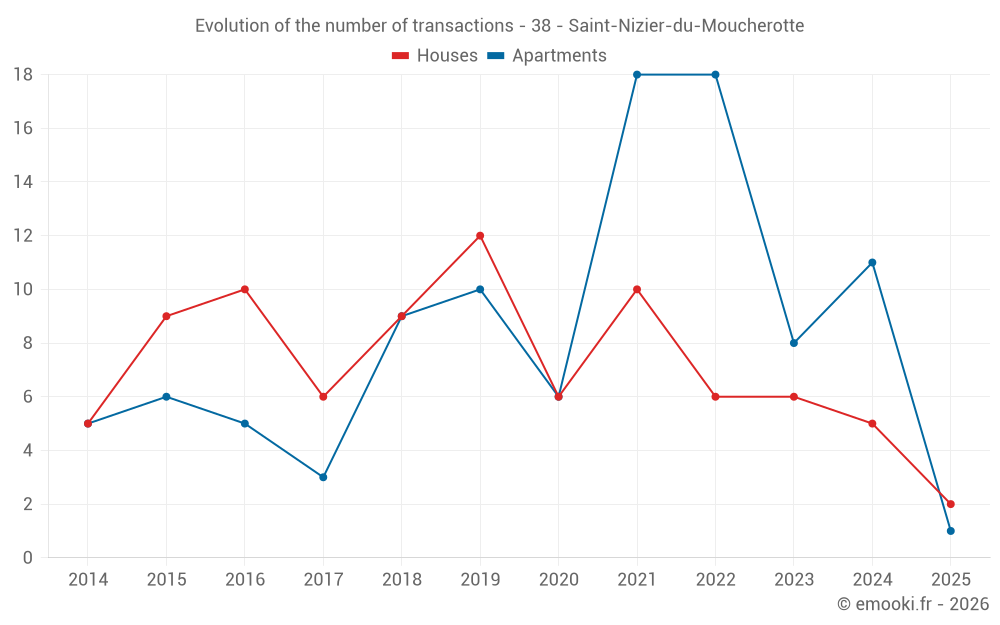
Median price on the 16 transactions of the last 36 months.
from 3 790 to
5 213  /m²
60% of transactions from the 2nd to the 8th deciles.
ApartmentsApartments
3 450  /m²
1-23-45-67-89-10
Reliability 7/10
Median price on the 14 transactions of the last 24 months.
from 3 164 to
4 059  /m²
60% of transactions from the 2nd to the 8th deciles.
DwellingsDwellings
3 901  /m²
1-23-45-67-89-10
Reliability 7/10
Median price on the 25 transactions of the last 24 months.
from 3 315 to
4 681  /m²
60% of transactions from the 2nd to the 8th deciles.

Yearly evolution

Evolution of the median price per m²

Evolution of the median price per m² - 38 - Saint-Nizier-du-Moucherotte

Evolution of the number of transactions

Warning, last year incomplete. Projections made based on the proportions between semesters of the previous year at the departmental/national level and by type of property.

Evolution of the number of transactions - 38 - Saint-Nizier-du-Moucherotte

Yearly data

Descending order
Year
Houses
house
transactions
Houses
house
Price per m²
Apartments
apt.
transactions
Apartments
apt.
Price per m²
2025
2
5 280 
1
3 601 
2024
5
4 432 
11
3 556 
2023
6
4 386 
8
2 669 
2022
6
3 386 
18
2 044 
2021
10
3 467 
18
1 956 
2020
6
3 636 
6
2 483 
2019
12
3 216 
10
2 589 
2018
9
3 417 
9
2 773 
2017
6
2 648 
3
2 924 
2016
10
2 232 
5
2 542 
2015
9
2 320 
6
2 364 
2014
5
2 108 
5
2 569 

Analysis

Structure of prices per m²

Values of price percentiles per m² over the periods used for the estimated price of each type of property.

Structure of transaction amounts

Values of transaction amounts percentiles over the periods used for the estimated price of each type of property.

Transaction amounts and prices per m² by percentile

Ascending order
Percentile
Houses
house
Price per m²
Houses
house
Transaction amount
Apartments
apt.
Price per m²
Apartments
apt.
Transaction amount
10th percentile
3 586 
238 K
3 136 
103 K
20th percentile
3 790 
362 K
3 164 
109 K
30th percentile
4 154 
381 K
3 245 
120 K
40th percentile
4 358 
414 K
3 334 
159 K
50th percentile
4 516 
479 K
3 450 
208 K
60th percentile
4 679 
523 K
3 592 
234 K
70th percentile
4 713 
533 K
3 769 
246 K
80th percentile
5 213 
550 K
4 059 
267 K
90th percentile
5 700 
722 K
4 297 
323 K

National and departmental comparison

Evolution of the median price per m² of houses

Evolution of the median price per m² of apartments

Quarterly evolution

Evolution of the median price per m²

Evolution of the number of transactions

Quarterly data

Descending order
Quarter
Houses
house
transactions
Houses
house
Price per m²
Apartments
apt.
transactions
Apartments
apt.
Price per m²
2025 Q2
0
--- 
1
3 601 
2025 Q1
2
5 280 
0
--- 
2024 Q4
2
4 284 
1
4 298 
2024 Q3
2
4 548 
1
3 331 
2024 Q2
0
--- 
6
3 728 
2024 Q1
1
5 213 
3
3 345 
2023 Q4
3
4 600 
1
3 253 
2023 Q3
1
3 435 
1
2 849 
2023 Q2
0
--- 
1
1 820 
2023 Q1
2
5 088 
5
2 489 
2022 Q4
2
4 659 
9
1 916 
2022 Q3
1
1 517 
6
2 738 
2022 Q2
0
--- 
1
1 877 
2022 Q1
3
2 982 
2
3 078 
2021 Q4
1
3 545 
7
1 954 
2021 Q3
5
3 203 
6
1 901 
2021 Q2
2
5 150 
3
1 900 
2021 Q1
2
2 409 
2
3 078 
2020 Q4
0
--- 
2
2 904 
2020 Q3
1
1 463 
3
2 473 
2020 Q2
2
4 879 
1
1 786 
2020 Q1
3
3 529 
0
--- 
2019 Q4
4
2 662 
5
1 075 
2019 Q3
4
3 196 
3
2 886 
2019 Q2
2
2 764 
1
3 188 
2019 Q1
2
3 942 
1
2 499 
2018 Q4
2
2 302 
2
2 757 
2018 Q3
3
3 736 
6
2 686 
2018 Q2
1
1 639 
0
--- 
2018 Q1
3
3 417 
1
2 806 
2017 Q4
1
2 811 
2
2 287 
2017 Q3
2
2 792 
1
2 924 
2017 Q2
2
1 372 
0
--- 
2017 Q1
1
2 619 
0
--- 
2016 Q4
4
2 004 
1
2 542 
2016 Q3
4
2 668 
2
2 454 
2016 Q2
1
1 319 
2
2 520 
2016 Q1
1
2 475 
0
--- 
2015 Q4
5
2 815 
2
1 528 
2015 Q3
1
2 222 
1
2 591 
2015 Q2
2
1 681 
2
1 246 
2015 Q1
1
2 362 
1
2 480 
2014 Q4
2
2 280 
1
2 647 
2014 Q3
2
2 972 
1
1 894 
2014 Q2
0
--- 
1
2 569 
2014 Q1
1
2 108 
2
2 542 

Overview of the latest real estate transactions

The following list is an anonymized overview of the latest transactions. For more details and to find all transactions, please use the map to view transactions by plot or the transaction search page for a search by criteria.

2025-04-04
284 500 
3 601  /m²(79 m²)
Sale
Apartments
Apartment
4 rooms
79 m2
2 outbuildings
2025-03-25
525 000 
4 688  /m²(112 m²)
Sale
Houses
House
4 rooms
112 m2
Land
998 m2
-Sols
Land
100 m2
-Sols
Land
2718 m2
-Sols
Land
103 m2
-Sols
2025-01-31
399 300 
5 872  /m²(68 m²)
Sale
Houses
House
3 rooms
68 m2
Land
1100 m2
-Sols
Land
190 m2
-Sols
2024-12-19
550 000 
4 135  /m²(133 m²)
Sale
Houses
House
5 rooms
133 m2
Land
747 m2
-Prés
2024-12-19
245 000 
4 298  /m²(57 m²)
Sale
Apartments
Apartment
3 rooms
57 m2
2024-12-16
1 196 650 
4 432  /m²(270 m²)
Sale
Houses
House
8 rooms
270 m2
Land
2760 m2
-Sols
Land
6999 m2
-Taillis simples
Land
6999 m2
-Futaies mixtes
Land
1621 m2
-Futaies mixtes
Land
1621 m2
-Taillis simples
2024-12-11
10 
Sale
Land
9 m2
-Sols
Land
15 m2
-Sols
2024-10-17
198 000 
14 143  /m²(14 m²)
Sale
Commercial property
14 m2
1 outbuilding
2024-09-13
113 270 
3 331  /m²(34 m²)
Sale
Apartments
Apartment
2 rooms
34 m2
1 outbuilding
2024-09-09
215 000 
Sale
Land
904 m2
-Terrains à bâtir
2024-08-28
7 172 
Sale
Land
8250 m2
-Futaies mixtes
Land
330 m2
-Futaies mixtes
Land
4625 m2
-Futaies mixtes
Land
9400 m2
-Futaies mixtes
Land
1300 m2
-Prés
2024-08-23
361 700 
4 358  /m²(83 m²)
Sale
Houses
House
4 rooms
83 m2
2024-08-08
6 000 
Sale
Land
16910 m2
-Futaies résineuses
2024-07-22
289 000 
4 738  /m²(61 m²)
Sale
Houses
House
4 rooms
61 m2
2024-06-26
395 000 
5 000  /m²(79 m²)
Sale
1 outbuilding
Land
43 m2
-Sols
Apartments
Apartment
2 rooms
45 m2
Apartments
Apartment
2 rooms
34 m2
1 outbuilding
Land
1347 m2
-Sols
Land
2 m2
-Prés
Land
669 m2
-Prés
Land
330 m2
-Prés
Land
237 m2
-Prés
2024-06-24
234 875 
3 132  /m²(75 m²)
Sale
Apartments
Apartment
3 rooms
75 m2
3 outbuildings
2024-06-13
339 370 
3 901  /m²(87 m²)
Sale
Apartments
Apartment
4 rooms
87 m2
1 outbuilding
2024-06-10
15 665 
Sale
Land
241 m2
-Prés
2024-05-29
360 000 
Sale
Land
1217 m2
-Prés
Land
270 m2
-Prés
2024-05-28
103 100 
4 296  /m²(24 m²)
Sale
Apartments
Apartment
1 room
24 m2
1 outbuilding
300 transactions listed in the municipality

Isère (38)

Most expensive cities

City
name
Descending orderHouses
house
Price per m²
8 262 
4 917 
4 777 
4 663 
4 610 
4 575 
4 506 
City
name
Descending orderApartments
apt.
Price per m²
7 647 
6 370 
5 636 
4 866 
4 524 
4 492 
4 249 
4 234 
3 958 

Least expensive cities

City
name
Ascending orderHouses
house
Price per m²
502 
722 
975 
1 133 
1 198 
1 237 
City
name
Ascending orderApartments
apt.
Price per m²
475 
483 
541 
562