Median price of real estate
in the municipality of Eybens
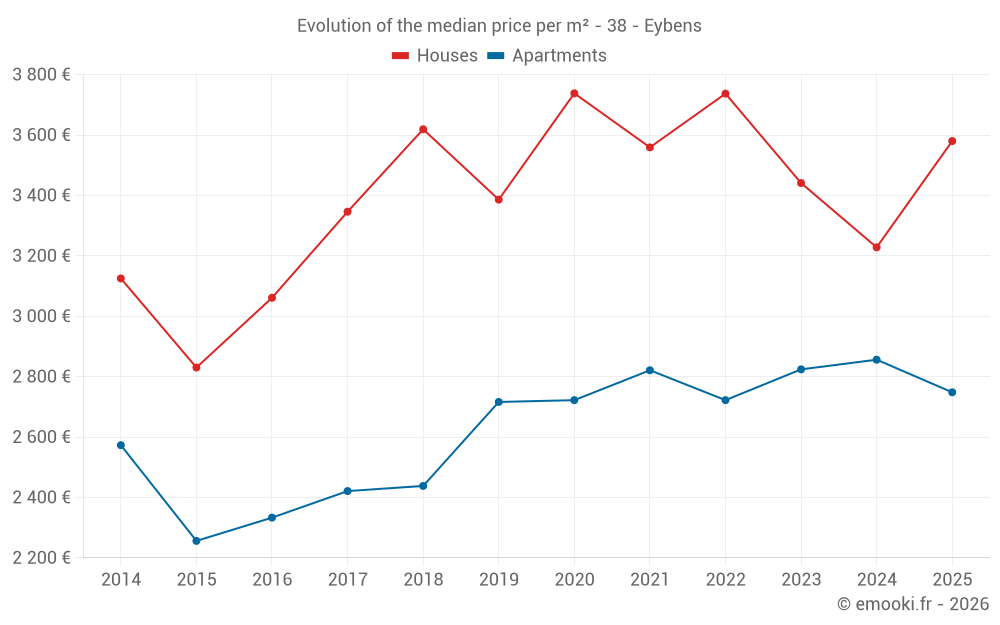
Houses
3 564 € /m²
Reliability 8/10
Median price on the 22 transactions of the last 12 months.
from 2 798 to
4 205 € /m²
4 205 € /m²
60% of transactions from the 2nd to the 8th deciles.
Apartments
2 748 € /m²
Reliability 9/10
Median price on the 41 transactions of the last 6 months.
from 2 069 to
3 250 € /m²
3 250 € /m²
60% of transactions from the 2nd to the 8th deciles.
Dwellings
2 868 € /m²
Reliability 9/10
Median price on the 50 transactions of the last 6 months.
from 2 209 to
3 611 € /m²
3 611 € /m²
60% of transactions from the 2nd to the 8th deciles.