emooki
HomePrice mapTransactions
🇬🇧 English🇫🇷 Français🇩🇪 Deutsch🇪🇸 Español🇮🇹 Italiano

Real estate price map


Real estate price map in the municipality of Villette-de-Vienne, choose a section to see transactions by parcel.

Isère (38)

Villette-de-Vienne - Real estate price m²

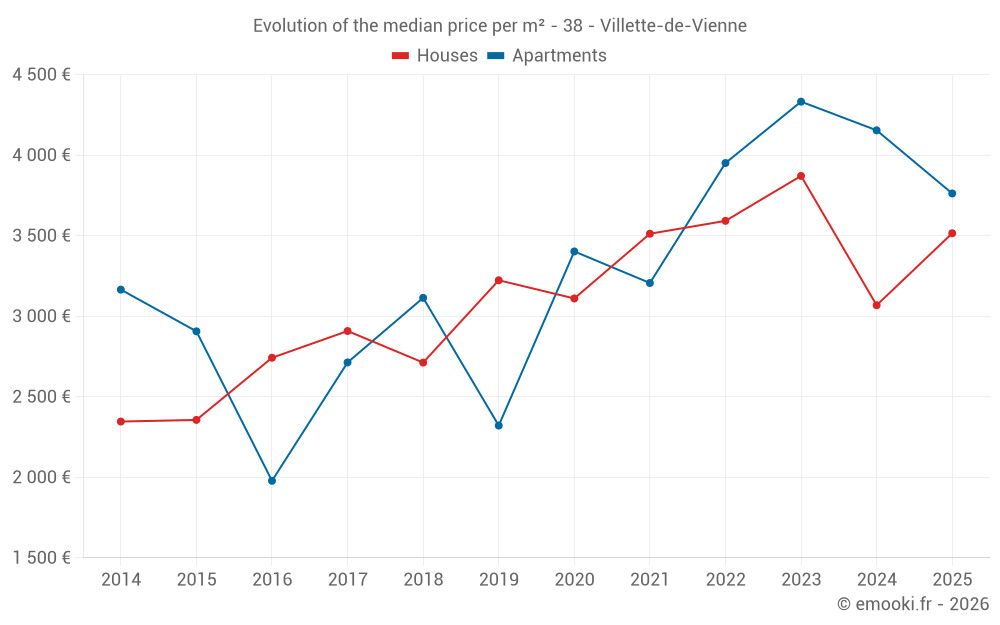
Median price of real estate
in the municipality of Villette-de-Vienne

HousesHouses
3 484  /m²
1-23-45-67-89-10
Reliability 7/10
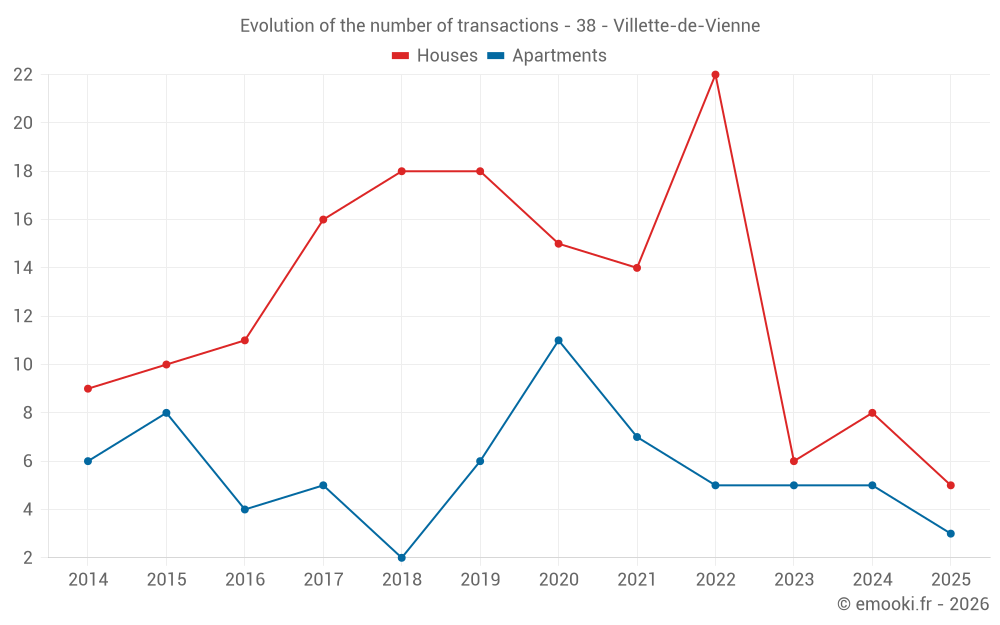
Median price on the 19 transactions of the last 24 months.
from 2 476 to
3 988  /m²
60% of transactions from the 2nd to the 8th deciles.
ApartmentsApartments
4 154  /m²
1-23-45-67-89-10
Reliability 6/10
Median price on the 15 transactions of the last 36 months.
from 3 852 to
4 433  /m²
60% of transactions from the 2nd to the 8th deciles.
DwellingsDwellings
3 792  /m²
1-23-45-67-89-10
Reliability 7/10
Median price on the 31 transactions of the last 24 months.
from 2 989 to
4 332  /m²
60% of transactions from the 2nd to the 8th deciles.
HousesEvolution of the price per m² of houses since...
1 year
+15%
2 years
-9.2%
3 years
-2.1%
4 years
+0.1%
5 years
+13%
6 years
+9.1%
7 years
+30%
8 years
+21%
9 years
+28%
10 years
+49%
11 years
+50%
The price per m² of houses has decreased by 9.2% since 2 years, but it has increased by 50% in 11 years.

Yearly evolution

Evolution of the median price per m²

Evolution of the median price per m² - 38 - Villette-de-Vienne

Evolution of the number of transactions

Warning, last year incomplete. Projections made based on the proportions between semesters of the previous year at the departmental/national level and by type of property.

Evolution of the number of transactions - 38 - Villette-de-Vienne

Yearly data

Descending order
Year
Houses
house
transactions
Houses
house
Price per m²
Apartments
apt.
transactions
Apartments
apt.
Price per m²
2025
5
3 515 
3
3 762 
2024
8
3 068 
5
4 154 
2023
6
3 871 
5
4 332 
2022
22
3 592 
5
3 951 
2021
14
3 512 
7
3 206 
2020
15
3 110 
11
3 402 
2019
18
3 223 
6
2 321 
2018
18
2 712 
2
3 114 
2017
16
2 908 
5
2 713 
2016
11
2 742 
4
1 978 
2015
10
2 356 
8
2 906 
2014
9
2 346 
6
3 165 

Analysis

Structure of prices per m²

Values of price percentiles per m² over the periods used for the estimated price of each type of property.

Structure of transaction amounts

Values of transaction amounts percentiles over the periods used for the estimated price of each type of property.

Transaction amounts and prices per m² by percentile

Ascending order
Percentile
Houses
house
Price per m²
Houses
house
Transaction amount
Apartments
apt.
Price per m²
Apartments
apt.
Transaction amount
10th percentile
1 395 
184 K
3 681 
187 K
20th percentile
2 476 
280 K
3 852 
189 K
30th percentile
3 014 
345 K
3 956 
210 K
40th percentile
3 147 
367 K
4 021 
239 K
50th percentile
3 484 
421 K
4 154 
248 K
60th percentile
3 705 
432 K
4 246 
268 K
70th percentile
3 841 
459 K
4 319 
281 K
80th percentile
3 988 
522 K
4 433 
286 K
90th percentile
4 928 
540 K
4 626 
325 K

National and departmental comparison

Evolution of the median price per m² of houses

Evolution of the median price per m² of apartments

Quarterly evolution

Evolution of the median price per m²

Evolution of the number of transactions

Quarterly data

Descending order
Quarter
Houses
house
transactions
Houses
house
Price per m²
Apartments
apt.
transactions
Apartments
apt.
Price per m²
2025 Q2
3
2 115 
1
3 627 
2025 Q1
2
4 132 
2
4 278 
2024 Q4
1
3 753 
0
--- 
2024 Q3
2
2 461 
3
4 230 
2024 Q2
3
3 086 
2
3 412 
2024 Q1
2
2 853 
0
--- 
2023 Q3
6
3 871 
4
4 300 
2023 Q2
0
--- 
1
4 615 
2022 Q4
7
3 481 
0
--- 
2022 Q3
4
4 196 
2
3 963 
2022 Q2
7
4 015 
1
3 570 
2022 Q1
4
3 132 
2
3 770 
2021 Q4
4
3 434 
4
2 600 
2021 Q3
4
3 393 
0
--- 
2021 Q2
2
3 299 
3
3 656 
2021 Q1
4
3 950 
0
--- 
2020 Q4
2
2 745 
3
3 516 
2020 Q3
9
2 635 
4
2 872 
2020 Q2
2
2 316 
3
3 402 
2020 Q1
2
3 824 
1
2 691 
2019 Q4
6
3 166 
2
1 672 
2019 Q3
5
3 618 
2
3 238 
2019 Q2
4
3 294 
1
1 571 
2019 Q1
3
2 977 
1
2 384 
2018 Q4
5
3 130 
0
--- 
2018 Q3
4
2 724 
2
3 114 
2018 Q2
3
2 917 
0
--- 
2018 Q1
6
2 492 
0
--- 
2017 Q4
5
2 931 
0
--- 
2017 Q3
3
3 173 
1
3 037 
2017 Q2
5
1 784 
0
--- 
2017 Q1
3
3 000 
4
2 606 
2016 Q4
5
2 391 
2
1 712 
2016 Q3
1
1 931 
1
2 093 
2016 Q2
3
3 248 
1
1 864 
2016 Q1
2
2 344 
0
--- 
2015 Q4
1
3 262 
0
--- 
2015 Q3
3
2 207 
2
2 642 
2015 Q2
3
2 331 
1
3 174 
2015 Q1
3
2 380 
5
2 974 
2014 Q4
3
2 170 
3
3 088 
2014 Q3
4
2 770 
2
3 276 
2014 Q2
2
2 896 
1
2 708 

Overview of the latest real estate transactions

The following list is an anonymized overview of the latest transactions. For more details and to find all transactions, please use the map to view transactions by plot or the transaction search page for a search by criteria.

2025-05-23
286 500 
3 627  /m²(79 m²)
Sale
Apartments
Apartment
4 rooms
79 m2
1 outbuilding
2025-04-18
406 152 
2 115  /m²(192 m²)
Sale
Houses
House
2 rooms
89 m2
Houses
House
4 rooms
103 m2
1 outbuilding
Land
3261 m2
-Sols
2025-04-18
523 000 
3 874  /m²(135 m²)
Sale
Houses
House
4 rooms
135 m2
1 outbuilding
Land
838 m2
-Sols
Land
402 m2
-Jardins
Land
133 m2
-Sols
2025-04-04
220 000 
Sale
Land
840 m2
-Sols
2025-04-01
15 000 
63  /m²(240 m²)
Sale
Houses
House
8 rooms
240 m2
2 outbuildings
Land
2780 m2
-Sols
Land
7502 m2
-Terres
Land
2670 m2
-Prés
Land
10090 m2
-Taillis simples
Land
10770 m2
-Prés
Land
9350 m2
-Taillis simples
Land
1015 m2
-Terres
Land
1720 m2
-Taillis simples
Land
95 m2
-Landes
Land
13740 m2
-Prés
Land
18545 m2
-Terres
Land
1810 m2
-Landes
Land
92 m2
-Prés
Land
19639 m2
-Prés
Land
7917 m2
-Taillis simples
Land
5636 m2
-Terres
2025-03-31
475 000 
4 750  /m²(100 m²)
Sale
Houses
House
5 rooms
100 m2
Land
465 m2
-Sols
2025-03-20
187 000 
4 795  /m²(39 m²)
Sale
Apartments
Apartment
2 rooms
39 m2
1 outbuilding
2025-02-18
237 000 
3 762  /m²(63 m²)
Sale
Apartments
Apartment
3 rooms
63 m2
1 outbuilding
2025-01-22
432 300 
3 515  /m²(123 m²)
Sale
Houses
House
4 rooms
123 m2
1 outbuilding
Land
445 m2
-Sols
Land
750 m2
-Sols
2024-10-18
431 620 
3 753  /m²(115 m²)
Sale
Houses
House
4 rooms
115 m2
Land
328 m2
-Sols
2024-09-18
1 500 
Sale
Land
8 m2
-Sols
2024-08-27
105 000 
1 438  /m²(73 m²)
Sale
Houses
House
3 rooms
73 m2
1 outbuilding
2024-07-30
248 000 
3 875  /m²(64 m²)
Sale
Apartments
Apartment
3 rooms
64 m2
1 outbuilding
2024-07-26
190 000 
4 634  /m²(41 m²)
Sale
Apartments
Apartment
2 rooms
41 m2
1 outbuilding
2024-07-18
348 390 
3 484  /m²(100 m²)
Sale
Houses
House
4 rooms
100 m2
Land
1000 m2
-Sols
Land
544 m2
-Terrains d'agrément
2024-07-01
266 500 
4 230  /m²(63 m²)
Sale
Apartments
Apartment
3 rooms
63 m2
1 outbuilding
2024-06-27
270 000 
4 154  /m²(65 m²)
Sale
Apartments
Apartment
3 rooms
65 m2
2024-06-19
357 000 
3 051  /m²(117 m²)
Sale
Houses
House
5 rooms
117 m2
Land
303 m2
-Sols
2024-05-13
287 000 
3 086  /m²(93 m²)
Sale
Houses
House
4 rooms
93 m2
Land
1205 m2
-Sols
Land
1262 m2
-Sols
2024-04-15
186 900 
2 670  /m²(70 m²)
Sale
Apartments
Apartment
2 rooms
70 m2
399 transactions listed in the municipality

Isère (38)

Most expensive cities

City
name
Descending orderHouses
house
Price per m²
8 262 
4 917 
4 777 
4 663 
4 610 
4 575 
4 506 
City
name
Descending orderApartments
apt.
Price per m²
7 647 
6 370 
5 636 
4 866 
4 524 
4 492 
4 249 
4 234 
3 958 

Least expensive cities

City
name
Ascending orderHouses
house
Price per m²
502 
722 
975 
1 133 
1 198 
1 237 
City
name
Ascending orderApartments
apt.
Price per m²
475 
483 
541 
562