emooki
HomePrice mapTransactions
🇬🇧 English🇫🇷 Français🇩🇪 Deutsch🇪🇸 Español🇮🇹 Italiano

Real estate price map


Real estate price map in the municipality of Poisat, choose a section to see transactions by parcel.

Isère (38)

Poisat - Real estate price m²

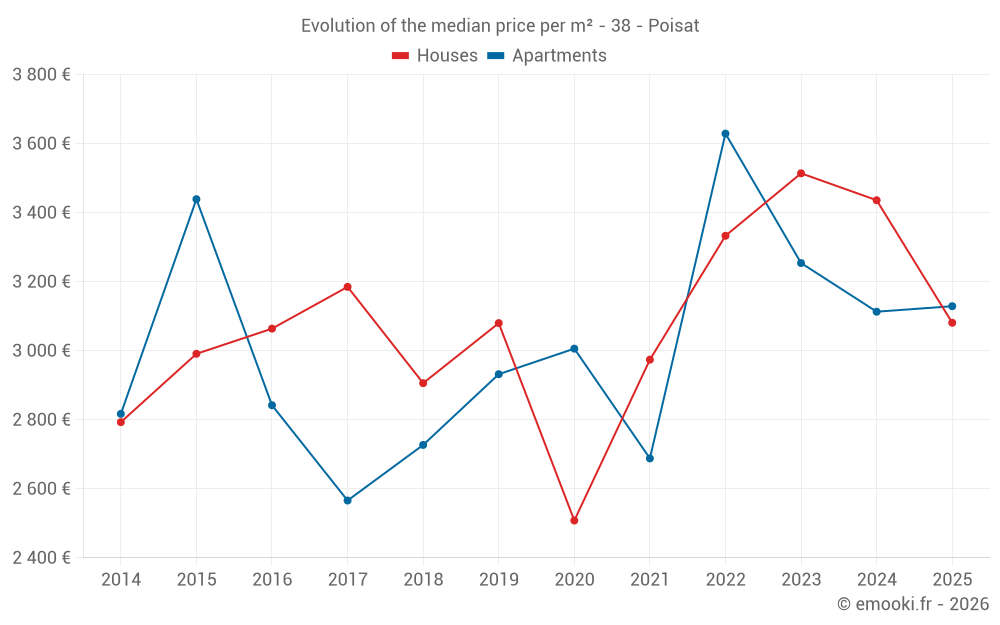
Median price of real estate
in the municipality of Poisat

HousesHouses
3 436  /m²
1-23-45-67-89-10
Reliability 7/10
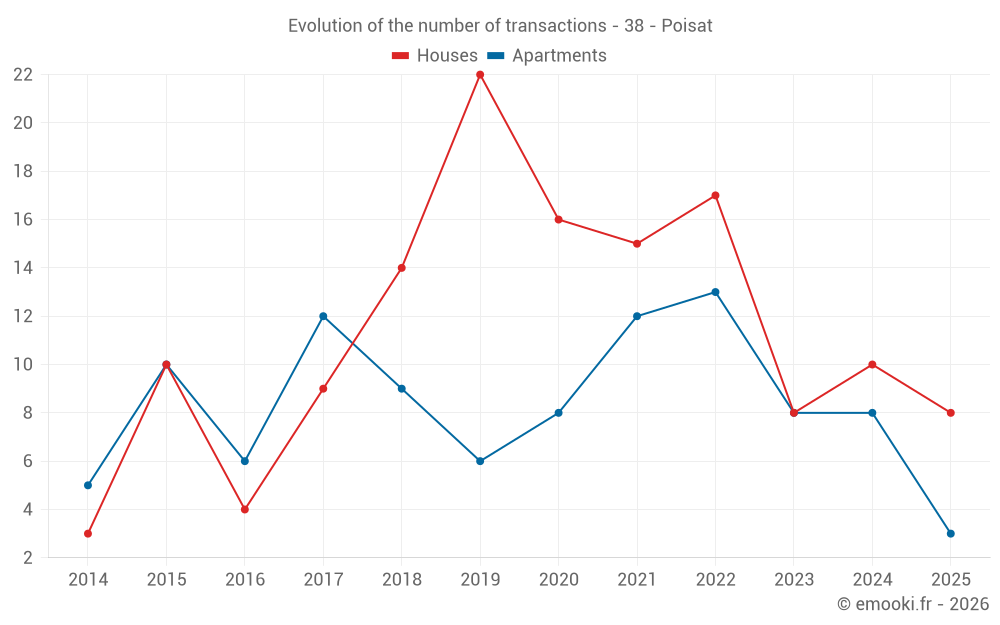
Median price on the 22 transactions of the last 24 months.
from 2 560 to
3 932  /m²
60% of transactions from the 2nd to the 8th deciles.
ApartmentsApartments
3 131  /m²
1-23-45-67-89-10
Reliability 7/10
Median price on the 14 transactions of the last 24 months.
from 2 894 to
3 554  /m²
60% of transactions from the 2nd to the 8th deciles.
DwellingsDwellings
3 133  /m²
1-23-45-67-89-10
Reliability 8/10
Median price on the 19 transactions of the last 12 months.
from 2 492 to
3 711  /m²
60% of transactions from the 2nd to the 8th deciles.
HousesEvolution of the price per m² of houses since...
1 year
-10%
2 years
-12%
3 years
-7.6%
4 years
+3.6%
5 years
+23%
6 years
+0%
7 years
+6%
8 years
-3.3%
9 years
+0.6%
10 years
+3%
11 years
--
The price per m² of houses has decreased by 12% since 2 years, but it has increased by 23% in 5 years.

Yearly evolution

Evolution of the median price per m²

Evolution of the median price per m² - 38 - Poisat

Evolution of the number of transactions

Warning, last year incomplete. Projections made based on the proportions between semesters of the previous year at the departmental/national level and by type of property.

Evolution of the number of transactions - 38 - Poisat

Yearly data

Descending order
Year
Houses
house
transactions
Houses
house
Price per m²
Apartments
apt.
transactions
Apartments
apt.
Price per m²
2025
8
3 081 
3
3 129 
2024
10
3 436 
8
3 113 
2023
8
3 514 
8
3 254 
2022
17
3 333 
13
3 629 
2021
15
2 974 
12
2 688 
2020
16
2 508 
8
3 006 
2019
22
3 080 
6
2 932 
2018
14
2 906 
9
2 727 
2017
9
3 185 
12
2 566 
2016
4
3 064 
6
2 842 
2015
10
2 991 
10
3 439 
2014
3
2 793 
5
2 817 

Analysis

Structure of prices per m²

Values of price percentiles per m² over the periods used for the estimated price of each type of property.

Structure of transaction amounts

Values of transaction amounts percentiles over the periods used for the estimated price of each type of property.

Transaction amounts and prices per m² by percentile

Ascending order
Percentile
Houses
house
Price per m²
Houses
house
Transaction amount
Apartments
apt.
Price per m²
Apartments
apt.
Transaction amount
10th percentile
1 818 
297 K
2 584 
185 K
20th percentile
2 560 
323 K
2 894 
217 K
30th percentile
2 932 
340 K
3 075 
232 K
40th percentile
3 151 
378 K
3 100 
238 K
50th percentile
3 436 
394 K
3 131 
258 K
60th percentile
3 647 
424 K
3 245 
260 K
70th percentile
3 695 
434 K
3 397 
272 K
80th percentile
3 932 
457 K
3 554 
334 K
90th percentile
4 316 
489 K
3 667 
437 K

National and departmental comparison

Evolution of the median price per m² of houses

Evolution of the median price per m² of apartments

Quarterly evolution

Evolution of the median price per m²

Evolution of the number of transactions

Quarterly data

Descending order
Quarter
Houses
house
transactions
Houses
house
Price per m²
Apartments
apt.
transactions
Apartments
apt.
Price per m²
2025 Q2
2
3 670 
1
3 674 
2025 Q1
6
2 283 
2
2 784 
2024 Q4
0
--- 
1
3 093 
2024 Q3
5
3 500 
2
3 103 
2024 Q2
4
3 348 
3
3 387 
2024 Q1
1
3 373 
2
3 138 
2023 Q4
0
--- 
1
2 566 
2023 Q3
4
3 342 
2
3 817 
2023 Q2
4
3 514 
2
3 581 
2023 Q1
0
--- 
3
3 071 
2022 Q4
2
3 190 
4
3 664 
2022 Q3
5
3 404 
6
3 814 
2022 Q2
6
3 947 
2
3 358 
2022 Q1
4
2 990 
1
2 886 
2021 Q4
1
4 441 
4
2 701 
2021 Q3
3
3 762 
4
2 920 
2021 Q2
6
3 338 
2
2 948 
2021 Q1
5
2 688 
2
2 676 
2020 Q4
4
1 682 
3
2 971 
2020 Q3
6
2 640 
3
2 904 
2020 Q2
4
3 408 
1
3 242 
2020 Q1
2
2 236 
1
3 387 
2019 Q4
7
3 060 
1
1 849 
2019 Q3
6
2 799 
1
3 001 
2019 Q2
4
3 506 
4
2 966 
2019 Q1
5
3 316 
0
--- 
2018 Q4
4
3 366 
3
2 205 
2018 Q3
5
2 936 
1
3 257 
2018 Q2
1
2 550 
2
3 342 
2018 Q1
4
2 979 
3
2 321 
2017 Q4
3
2 995 
0
--- 
2017 Q3
3
2 858 
4
2 266 
2017 Q2
2
3 560 
2
2 521 
2017 Q1
1
3 473 
6
2 777 
2016 Q4
1
3 244 
2
2 480 
2016 Q2
3
2 885 
2
2 622 
2016 Q1
0
--- 
2
3 083 
2015 Q4
1
2 685 
3
2 923 
2015 Q3
5
2 933 
3
3 627 
2015 Q2
1
3 890 
4
3 439 
2015 Q1
3
3 049 
0
--- 
2014 Q3
2
2 976 
4
2 734 
2014 Q1
1
2 479 
1
2 817 

Overview of the latest real estate transactions

The following list is an anonymized overview of the latest transactions. For more details and to find all transactions, please use the map to view transactions by plot or the transaction search page for a search by criteria.

2025-06-26
430 000 
1 727  /m²(249 m²)
Sale
Commercial property
249 m2
2025-06-12
1 
Sale
Land
46 m2
-Sols
2025-05-16
155 000 
1 069  /m²(145 m²)
Sale
Commercial property
145 m2
2025-05-12
12 000 
Sale
Land
3515 m2
-Prés
Land
12459 m2
-Prés
Land
3980 m2
-Prés
Land
3980 m2
-Prés
2025-04-28
421 500 
3 634  /m²(116 m²)
Sale
Houses
House
6 rooms
116 m2
2025-04-25
374 380 
3 707  /m²(101 m²)
Sale
Houses
House
5 rooms
101 m2
1 outbuilding
Land
532 m2
-Sols
2025-04-18
485 000 
3 674  /m²(132 m²)
Sale
Apartments
Apartment
2 rooms
58 m2
Apartments
Apartment
3 rooms
74 m2
1 outbuilding
Land
600 m2
-Jardins
/Jardin potager
Land
500 m2
-Sols
2025-03-26
384 000 
1 778  /m²(216 m²)
Sale
Houses
House
5 rooms
108 m2
Houses
House
5 rooms
108 m2
1 outbuilding
2025-03-21
478 000 
2 439  /m²(196 m²)
Sale
Apartments
Apartment
2 rooms
40 m2
Apartments
Apartment
3 rooms
156 m2
Land
482 m2
-Sols
2025-03-18
402 540 
4 282  /m²(94 m²)
Sale
Houses
House
5 rooms
94 m2
2 outbuildings
2025-02-25
325 000 
4 392  /m²(74 m²)
Sale
Houses
House
4 rooms
74 m2
1 outbuilding
Land
475 m2
-Sols
Land
1 m2
-Sols
2025-02-20
435 900 
1 794  /m²(243 m²)
Sale
Land
72 m2
-Sols
Apartments
Apartment
2 rooms
23 m2
Apartments
Apartment
1 room
19 m2
Houses
House
4 rooms
128 m2
Houses
House
3 rooms
73 m2
Land
296 m2
-Sols
2025-02-07
266 000 
3 129  /m²(85 m²)
Sale
Apartments
Apartment
4 rooms
85 m2
2 outbuildings
1 outbuilding
2025-01-30
163 000 
2 038  /m²(80 m²)
Sale
Houses
House
5 rooms
80 m2
1 outbuilding
Land
367 m2
-Terrains à bâtir
2025-01-30
182 000 
Sale
Land
498 m2
-Terrains à bâtir
Land
29 m2
-Sols
2025-01-24
490 500 
2 528  /m²(194 m²)
Sale
Land
141 m2
-Sols
Houses
House
7 rooms
194 m2
Land
430 m2
-Sols
2025-01-10
155 000 
Sale
Land
403 m2
-Terrains à bâtir
2024-12-19
185 000 
1 850  /m²(100 m²)
Sale
Commercial property
100 m2
2024-11-29
1 
Sale
Land
122 m2
-Sols
Land
281 m2
-Sols
2024-11-07
232 000 
3 093  /m²(75 m²)
Sale
Apartments
Apartment
4 rooms
75 m2
413 transactions listed in the municipality

Isère (38)

Most expensive cities

City
name
Descending orderHouses
house
Price per m²
8 262 
4 917 
4 777 
4 663 
4 610 
4 575 
4 506 
City
name
Descending orderApartments
apt.
Price per m²
7 647 
6 370 
5 636 
4 866 
4 524 
4 492 
4 249 
4 234 
3 958 

Least expensive cities

City
name
Ascending orderHouses
house
Price per m²
502 
722 
975 
1 133 
1 198 
1 237 
City
name
Ascending orderApartments
apt.
Price per m²
475 
483 
541 
562