emooki
HomePrice mapTransactions
🇬🇧 English🇫🇷 Français🇩🇪 Deutsch🇪🇸 Español🇮🇹 Italiano

Real estate price map


Real estate price map in the municipality of La Balme-les-Grottes, choose a section to see transactions by parcel.

Isère (38)

La Balme-les-Grottes - Real estate price m²

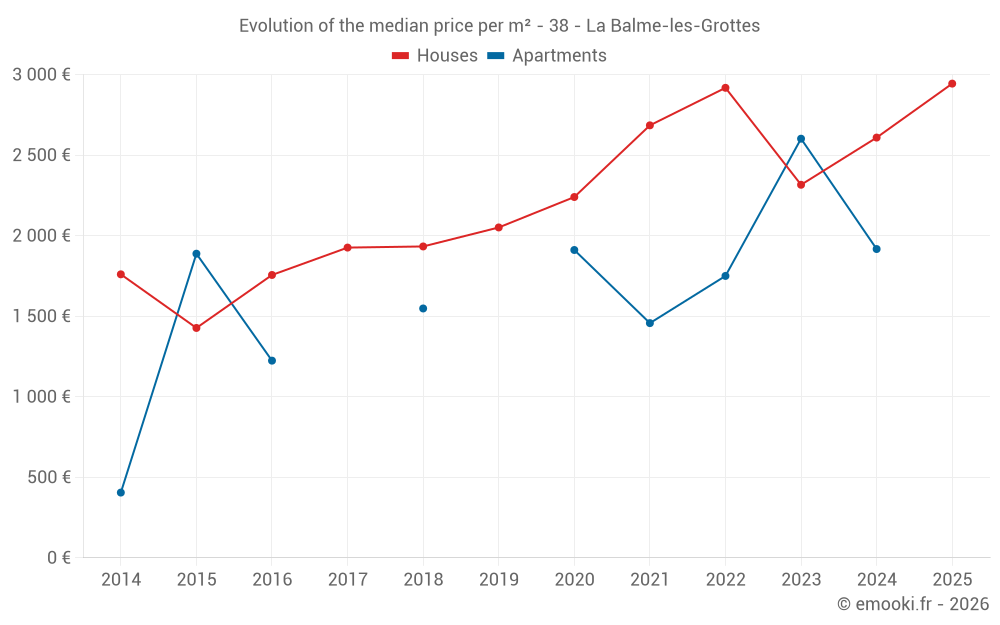
Median price of real estate
in the municipality of La Balme-les-Grottes

HousesHouses
2 593  /m²
1-23-45-67-89-10
Reliability 7/10
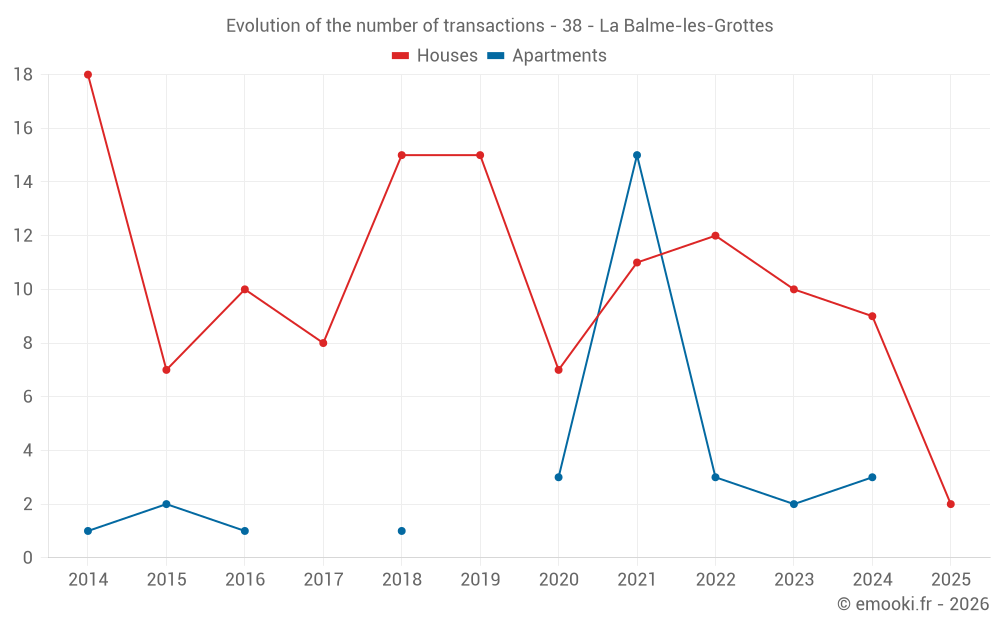
Median price on the 15 transactions of the last 24 months.
from 2 187 to
2 765  /m²
60% of transactions from the 2nd to the 8th deciles.
ApartmentsApartments
1 582  /m²
1-23-45-67-89-10
Reliability 5/10
Median price on the 17 transactions of the last 48 months.
from 1 350 to
1 902  /m²
60% of transactions from the 2nd to the 8th deciles.
DwellingsDwellings
2 593  /m²
1-23-45-67-89-10
Reliability 7/10
Median price on the 19 transactions of the last 24 months.
from 1 797 to
2 854  /m²
60% of transactions from the 2nd to the 8th deciles.

Yearly evolution

Evolution of the median price per m²

Evolution of the median price per m² - 38 - La Balme-les-Grottes

Evolution of the number of transactions

Warning, last year incomplete. Projections made based on the proportions between semesters of the previous year at the departmental/national level and by type of property.

Evolution of the number of transactions - 38 - La Balme-les-Grottes

Yearly data

Descending order
Year
Houses
house
transactions
Houses
house
Price per m²
Apartments
apt.
transactions
Apartments
apt.
Price per m²
2025
2
2 944 
0
--- 
2024
9
2 609 
3
1 917 
2023
10
2 316 
2
2 602 
2022
12
2 918 
3
1 750 
2021
11
2 685 
15
1 457 
2020
7
2 240 
3
1 911 
2019
15
2 051 
0
--- 
2018
15
1 933 
1
1 548 
2017
8
1 926 
0
--- 
2016
10
1 756 
1
1 224 
2015
7
1 427 
2
1 888 
2014
18
1 760 
1
405 

Analysis

Structure of prices per m²

Values of price percentiles per m² over the periods used for the estimated price of each type of property.

Structure of transaction amounts

Values of transaction amounts percentiles over the periods used for the estimated price of each type of property.

Transaction amounts and prices per m² by percentile

Ascending order
Percentile
Houses
house
Price per m²
Houses
house
Transaction amount
Apartments
apt.
Price per m²
Apartments
apt.
Transaction amount
10th percentile
1 554 
131 K
1 333 
65 000 
20th percentile
2 187 
212 K
1 350 
67 000 
30th percentile
2 500 
240 K
1 369 
67 000 
40th percentile
2 538 
242 K
1 479 
70 000 
50th percentile
2 593 
247 K
1 582 
77 500 
60th percentile
2 626 
261 K
1 643 
86 600 
70th percentile
2 664 
278 K
1 769 
92 900 
80th percentile
2 765 
283 K
1 902 
114 K
90th percentile
2 958 
299 K
2 433 
178 K

National and departmental comparison

Evolution of the median price per m² of houses

Evolution of the median price per m² of apartments

Quarterly evolution

Evolution of the median price per m²

Evolution of the number of transactions

Quarterly data

Descending order
Quarter
Houses
house
transactions
Houses
house
Price per m²
Apartments
apt.
transactions
Apartments
apt.
Price per m²
2025 Q1
2
2 944 
0
--- 
2024 Q4
1
2 935 
1
1 917 
2024 Q3
6
2 554 
1
2 800 
2024 Q2
1
2 667 
1
1 582 
2024 Q1
1
2 563 
0
--- 
2023 Q4
3
2 500 
0
--- 
2023 Q3
1
1 617 
1
3 016 
2023 Q2
2
1 873 
1
2 188 
2023 Q1
4
2 301 
0
--- 
2022 Q4
3
2 842 
0
--- 
2022 Q3
7
3 000 
1
1 750 
2022 Q2
1
3 606 
1
1 844 
2022 Q1
1
2 093 
1
1 660 
2021 Q4
5
2 722 
8
1 356 
2021 Q3
5
2 685 
1
1 618 
2021 Q2
0
--- 
2
2 184 
2021 Q1
1
2 294 
4
1 606 
2020 Q4
3
2 240 
0
--- 
2020 Q3
3
2 271 
3
1 911 
2020 Q2
1
2 000 
0
--- 
2019 Q4
3
2 285 
0
--- 
2019 Q3
4
1 891 
0
--- 
2019 Q2
4
2 519 
0
--- 
2019 Q1
4
1 718 
0
--- 
2018 Q4
6
1 388 
1
1 548 
2018 Q3
5
1 968 
0
--- 
2018 Q2
3
1 991 
0
--- 
2018 Q1
1
1 357 
0
--- 
2017 Q4
4
1 820 
0
--- 
2017 Q3
1
2 289 
0
--- 
2017 Q2
2
1 250 
0
--- 
2017 Q1
1
2 404 
0
--- 
2016 Q4
5
1 779 
0
--- 
2016 Q3
2
2 049 
1
1 224 
2016 Q2
3
1 733 
0
--- 
2015 Q4
3
1 321 
0
--- 
2015 Q3
1
1 477 
2
1 888 
2015 Q2
3
1 427 
0
--- 
2014 Q4
5
1 725 
0
--- 
2014 Q3
8
1 760 
1
405 
2014 Q2
4
1 550 
0
--- 
2014 Q1
1
1 833 
0
--- 

Overview of the latest real estate transactions

The following list is an anonymized overview of the latest transactions. For more details and to find all transactions, please use the map to view transactions by plot or the transaction search page for a search by criteria.

2025-05-07
2 600 
Sale
Land
3543 m2
-Taillis sous futaie
2025-03-03
2 095 
Sale
Land
2376 m2
-Landes
Land
860 m2
-Landes
Land
1749 m2
-Landes
Land
5490 m2
-Terres
2025-03-03
290 000 
3 295  /m²(88 m²)
Sale
Houses
House
4 rooms
88 m2
2 outbuildings
Land
600 m2
-Terrains d'agrément
/Parc
Land
570 m2
-Sols
2025-01-27
280 000 
2 593  /m²(108 m²)
Sale
Houses
House
4 rooms
108 m2
Land
744 m2
-Sols
2025-01-21
70 337 
Sale
Land
276 m2
-Terrains à bâtir
Land
334 m2
-Terrains à bâtir
Land
574 m2
-Terrains à bâtir
Land
18 m2
-Terrains à bâtir
Land
274 m2
-Landes
2024-12-17
2 000 
Sale
Land
3543 m2
-Taillis sous futaie
2024-12-17
9 000 
Sale
Land
925 m2
-Terres
2024-11-27
40 000 
Sale
Land
10767 m2
-Taillis simples
Land
19164 m2
-Terres
Land
93830 m2
-Taillis sous futaie
Land
18150 m2
-Pâtures
/Pâture plantée
2024-11-07
270 000 
2 935  /m²(92 m²)
Sale
Houses
House
4 rooms
92 m2
2024-11-06
2 000 
Sale
Land
3920 m2
-Terres
2024-10-15
92 000 
1 917  /m²(48 m²)
Sale
Apartments
Apartment
2 rooms
48 m2
2024-10-02
1 400 000 
1 557  /m²(899 m²)
15 909  /m²(88 m²)
Sale
Houses
House
2 rooms
88 m2
Commercial property
545 m2
Commercial property
266 m2
Land
3200 m2
-Prés
Land
6056 m2
-Sols
Land
835 m2
-Terres
2024-09-24
281 000 
2 651  /m²(106 m²)
Sale
Houses
House
5 rooms
106 m2
1 outbuilding
Land
824 m2
-Sols
Land
169 m2
-Landes
2024-09-24
15 000 
Sale
Land
199 m2
-Jardins
2024-09-02
200 000 
2 500  /m²(80 m²)
Sale
Houses
House
3 rooms
80 m2
1 outbuilding
Land
374 m2
-Sols
Land
230 m2
-Sols
2024-08-29
240 000 
2 609  /m²(92 m²)
Sale
Houses
House
4 rooms
92 m2
2024-08-28
3 800 
Sale
Land
10427 m2
-Prés
2024-08-09
210 000 
2 800  /m²(75 m²)
Sale
Apartments
Apartment
3 rooms
75 m2
1 outbuilding
2024-07-23
243 450 
1 512  /m²(161 m²)
Sale
Houses
House
5 rooms
161 m2
Land
329 m2
-Sols
2024-07-11
85 000 
1 118  /m²(76 m²)
Sale
Houses
House
3 rooms
76 m2
2 outbuildings
Land
291 m2
-Sols
230 transactions listed in the municipality

Isère (38)

Most expensive cities

City
name
Descending orderHouses
house
Price per m²
8 262 
4 917 
4 777 
4 663 
4 610 
4 575 
4 506 
City
name
Descending orderApartments
apt.
Price per m²
7 647 
6 370 
5 636 
4 866 
4 524 
4 492 
4 249 
4 234 
3 958 

Least expensive cities

City
name
Ascending orderHouses
house
Price per m²
502 
722 
975 
1 133 
1 198 
1 237 
City
name
Ascending orderApartments
apt.
Price per m²
475 
483 
541 
562