Median price of real estate
in the municipality of Hières-sur-Amby
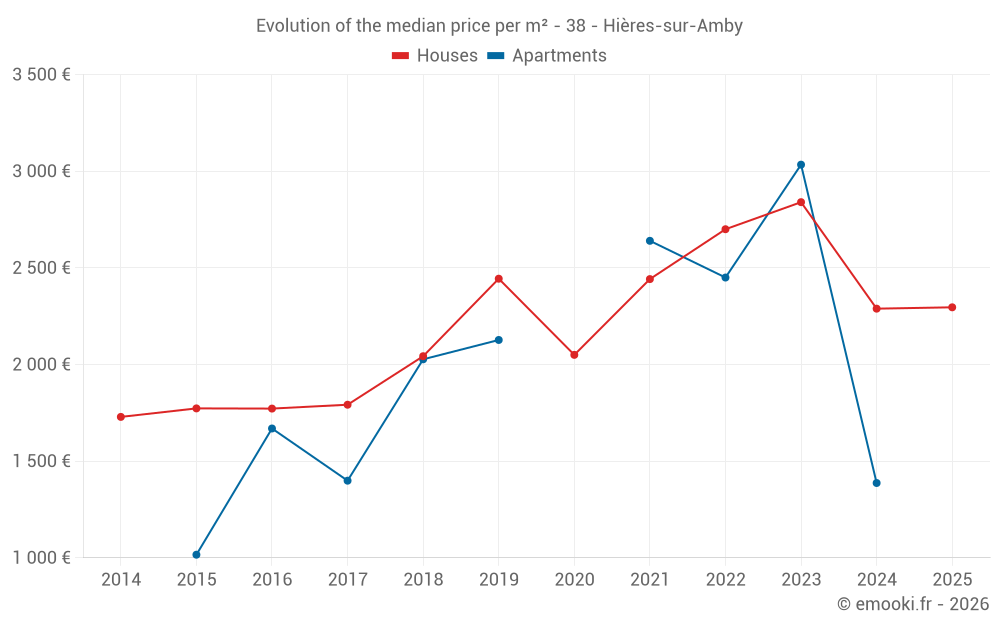
Houses
2 466 € /m²
Reliability 7/10
Median price on the 22 transactions of the last 24 months.
from 1 812 to
3 262 € /m²
3 262 € /m²
60% of transactions from the 2nd to the 8th deciles.
Apartments
2 450 € /m²
Reliability 5/10
Median price on the 10 transactions of the last 48 months.
Dwellings
2 289 € /m²
Reliability 7/10
Median price on the 24 transactions of the last 24 months.
from 1 555 to
3 089 € /m²
3 089 € /m²
60% of transactions from the 2nd to the 8th deciles.