emooki
HomePrice mapTransactions
🇬🇧 English🇫🇷 Français🇩🇪 Deutsch🇪🇸 Español🇮🇹 Italiano

Real estate price map


Real estate price map in the municipality of Saint-Sorlin-en-Bugey, choose a section to see transactions by parcel.

Ain (01)

Saint-Sorlin-en-Bugey - Real estate price m²

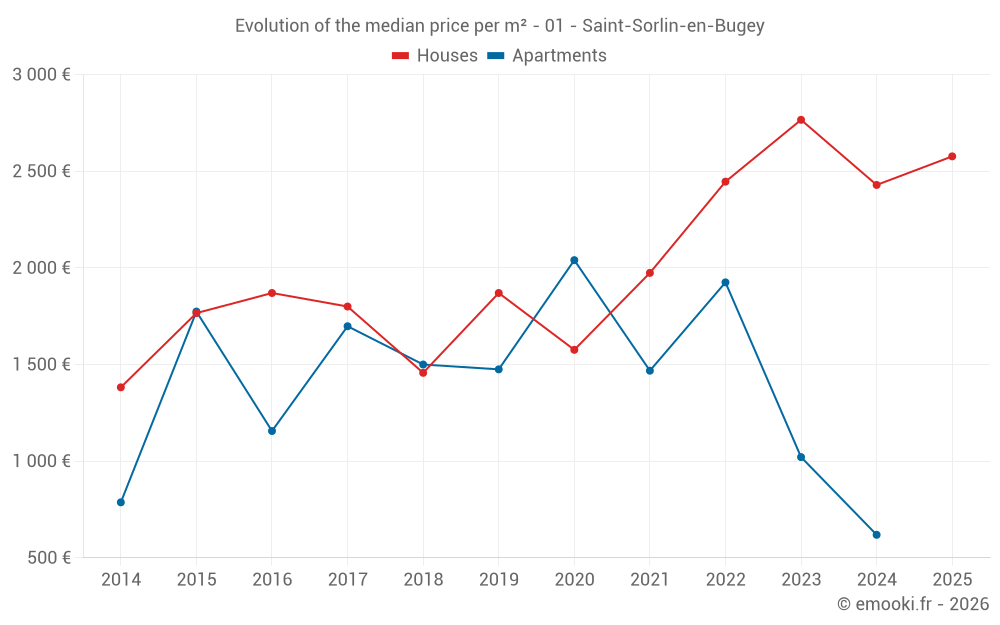
Median price of real estate
in the municipality of Saint-Sorlin-en-Bugey

HousesHouses
2 480  /m²
1-23-45-67-89-10
Reliability 7/10
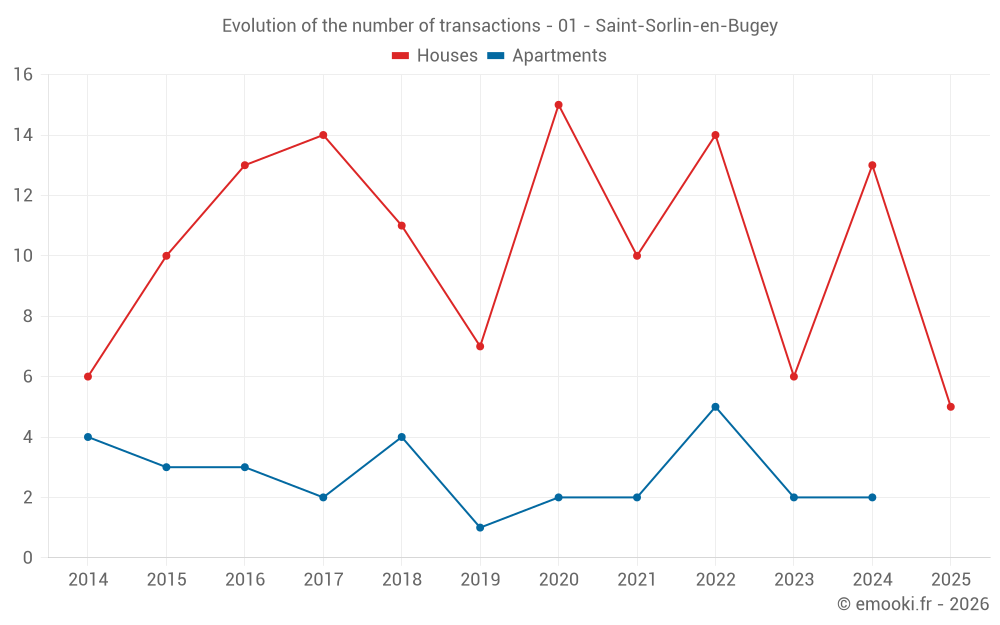
Median price on the 20 transactions of the last 24 months.
from 1 485 to
2 918  /m²
60% of transactions from the 2nd to the 8th deciles.
ApartmentsApartments
1 399  /m²
1-23-45-67-89-10
Reliability 5/10
Median price on the 11 transactions of the last 48 months.
from 698 to
1 962  /m²
60% of transactions from the 2nd to the 8th deciles.
DwellingsDwellings
2 283  /m²
1-23-45-67-89-10
Reliability 7/10
Median price on the 23 transactions of the last 24 months.
from 1 245 to
2 896  /m²
60% of transactions from the 2nd to the 8th deciles.
HousesEvolution of the price per m² of houses since...
1 year
+6.1%
2 years
-6.8%
3 years
+5.4%
4 years
+31%
5 years
+64%
6 years
+38%
7 years
+77%
8 years
+43%
9 years
+38%
10 years
+46%
11 years
+86%
The price per m² of houses has decreased by 6.8% since 2 years, but it has increased by 86% in 11 years.

Yearly evolution

Evolution of the median price per m²

Evolution of the median price per m² - 01 - Saint-Sorlin-en-Bugey

Evolution of the number of transactions

Warning, last year incomplete. Projections made based on the proportions between semesters of the previous year at the departmental/national level and by type of property.

Evolution of the number of transactions - 01 - Saint-Sorlin-en-Bugey

Yearly data

Descending order
Year
Houses
house
transactions
Houses
house
Price per m²
Apartments
apt.
transactions
Apartments
apt.
Price per m²
2025
5
2 577 
0
--- 
2024
13
2 429 
2
619 
2023
6
2 766 
2
1 021 
2022
14
2 446 
5
1 925 
2021
10
1 974 
2
1 468 
2020
15
1 576 
2
2 040 
2019
7
1 870 
1
1 475 
2018
11
1 457 
4
1 500 
2017
14
1 800 
2
1 698 
2016
13
1 870 
3
1 156 
2015
10
1 766 
3
1 774 
2014
6
1 382 
4
787 

Analysis

Structure of prices per m²

Values of price percentiles per m² over the periods used for the estimated price of each type of property.

Structure of transaction amounts

Values of transaction amounts percentiles over the periods used for the estimated price of each type of property.

Transaction amounts and prices per m² by percentile

Ascending order
Percentile
Houses
house
Price per m²
Houses
house
Transaction amount
Apartments
apt.
Price per m²
Apartments
apt.
Transaction amount
10th percentile
1 174 
93 100 
622 
30 000 
20th percentile
1 485 
154 K
698 
102 K
30th percentile
1 750 
209 K
700 
105 K
40th percentile
2 179 
230 K
1 342 
128 K
50th percentile
2 480 
262 K
1 399 
130 K
60th percentile
2 628 
274 K
1 555 
149 K
70th percentile
2 836 
298 K
1 925 
157 K
80th percentile
2 918 
326 K
1 962 
185 K
90th percentile
3 130 
388 K
2 292 
200 K

National and departmental comparison

Evolution of the median price per m² of houses

Evolution of the median price per m² of apartments

Quarterly evolution

Evolution of the median price per m²

Evolution of the number of transactions

Quarterly data

Descending order
Quarter
Houses
house
transactions
Houses
house
Price per m²
Apartments
apt.
transactions
Apartments
apt.
Price per m²
2025 Q2
3
2 577 
0
--- 
2025 Q1
2
2 566 
0
--- 
2024 Q4
2
2 626 
0
--- 
2024 Q3
6
2 238 
1
540 
2024 Q2
2
1 712 
1
698 
2024 Q1
3
2 531 
0
--- 
2023 Q3
2
1 996 
1
1 342 
2023 Q2
1
4 231 
1
700 
2023 Q1
3
2 649 
0
--- 
2022 Q4
2
2 562 
0
--- 
2022 Q3
3
2 368 
1
1 925 
2022 Q2
9
2 525 
3
1 962 
2022 Q1
0
--- 
1
1 555 
2021 Q4
3
1 820 
1
622 
2021 Q3
2
2 128 
1
2 313 
2021 Q2
2
1 440 
0
--- 
2021 Q1
3
2 081 
0
--- 
2020 Q4
6
1 724 
2
2 040 
2020 Q3
6
1 552 
0
--- 
2020 Q2
2
1 674 
0
--- 
2020 Q1
1
1 310 
0
--- 
2019 Q4
2
1 766 
0
--- 
2019 Q3
1
2 002 
0
--- 
2019 Q2
2
2 506 
0
--- 
2019 Q1
2
1 598 
1
1 475 
2018 Q4
2
1 686 
2
1 624 
2018 Q3
2
1 130 
1
1 526 
2018 Q2
5
1 981 
0
--- 
2018 Q1
2
878 
1
247 
2017 Q4
5
1 827 
1
1 600 
2017 Q3
6
2 061 
1
1 795 
2017 Q2
1
2 062 
0
--- 
2017 Q1
2
1 396 
0
--- 
2016 Q4
2
1 290 
2
1 271 
2016 Q3
4
1 700 
1
1 026 
2016 Q2
4
2 204 
0
--- 
2016 Q1
3
2 128 
0
--- 
2015 Q4
1
1 650 
0
--- 
2015 Q3
5
1 827 
1
769 
2015 Q2
0
--- 
1
1 975 
2015 Q1
4
2 018 
1
1 774 
2014 Q4
2
1 840 
3
684 
2014 Q3
2
1 714 
1
2 100 
2014 Q1
2
395 
0
--- 

Overview of the latest real estate transactions

The following list is an anonymized overview of the latest transactions. For more details and to find all transactions, please use the map to view transactions by plot or the transaction search page for a search by criteria.

2025-06-05
227 100 
2 704  /m²(84 m²)
Sale
Houses
House
5 rooms
84 m2
2 outbuildings
Land
1056 m2
-Sols
2025-05-26
268 000 
2 577  /m²(104 m²)
Sale
Houses
House
4 rooms
104 m2
Land
114 m2
-Sols
Land
875 m2
-Terres
Land
750 m2
-Vignes
2025-05-12
3 500 
Sale
Land
530 m2
-Vignes
2025-04-14
85 000 
1 181  /m²(72 m²)
Sale
Houses
House
5 rooms
72 m2
Land
73 m2
-Sols
Land
64 m2
-Jardins
2025-03-31
3 250 
Sale
Land
65 m2
-Jardins
2025-03-20
280 000 
3 111  /m²(90 m²)
Sale
Houses
House
4 rooms
90 m2
Land
760 m2
-Sols
2025-02-27
102 298 
Sale
Land
68 m2
-Sols
Land
1552 m2
-Prés
2025-02-26
130 000 
1 444  /m²(90 m²)
Sale
Commercial property
90 m2
Land
1964 m2
-Terres
Land
167 m2
-Terres
Land
31 m2
-Taillis simples
Land
807 m2
-Taillis simples
Land
820 m2
-Vignes
Land
137 m2
-Sols
Land
63 m2
-Sols
Land
63 m2
-Sols
Land
2333 m2
-Terres
Land
2220 m2
-Terres
Land
45 m2
-Sols
Land
1855 m2
-Vignes
Land
10 m2
-Sols
Land
1034 m2
-Vignes
Land
1163 m2
-Vignes
Land
206 m2
-Landes
Land
370 m2
-Taillis simples
Land
379 m2
-Landes
2025-02-20
182 000 
2 022  /m²(90 m²)
Sale
Houses
House
3 rooms
90 m2
Land
72 m2
-Sols
Land
211 m2
-Jardins
2025-01-24
1 670 
Sale
Land
4639 m2
-Terres
2025-01-17
40 000 
Sale
Land
60 m2
-Sols
Land
30 m2
-Sols
2024-11-08
300 
Sale
Land
580 m2
-Landes
Land
460 m2
-Vignes
/Vins délimités de qualité supérieure
Land
135 m2
-Landes
2024-11-06
500 
Sale
Land
380 m2
-Terres
Land
90 m2
-Terres
2024-10-10
4 610 
Sale
Land
11900 m2
-Taillis sous futaie
2024-10-07
231 500 
2 968  /m²(78 m²)
Sale
Houses
House
3 rooms
78 m2
1 outbuilding
Land
850 m2
-Sols
2024-10-02
315 000 
2 283  /m²(138 m²)
Sale
Houses
House
5 rooms
138 m2
Land
206 m2
-Sols
Land
145 m2
-Jardins
Land
117 m2
-Sols
Land
30 m2
-Prés
2024-09-26
27 000 
540  /m²(50 m²)
Sale
Apartments
Apartment
2 rooms
50 m2
2024-09-11
293 000 
2 817  /m²(104 m²)
Sale
Houses
House
5 rooms
104 m2
Land
392 m2
-Sols
2024-09-05
369 000 
2 906  /m²(127 m²)
Sale
Houses
House
4 rooms
127 m2
Land
793 m2
-Sols
Land
23 m2
-Sols
2024-08-28
94 000 
1 492  /m²(63 m²)
Sale
Houses
House
2 rooms
63 m2
Land
305 m2
-Sols
278 transactions listed in the municipality

Ain (01)

Most expensive cities

City
name
Descending orderHouses
house
Price per m²
5 676 
5 576 
5 534 
5 509 
5 248 
5 159 
5 146 
City
name
Descending orderApartments
apt.
Price per m²
5 372 
5 062 
5 000 
4 942 
4 889 
4 836 
4 787 
4 691 

Least expensive cities

City
name
Ascending orderHouses
house
Price per m²
797 
808 
816 
893 
927 
958 
1 034 
1 046 
City
name
Ascending orderApartments
apt.
Price per m²
157 
174 
185 
217 
336 
349 
380 
421 
444