emooki
HomePrice mapTransactions
🇬🇧 English🇫🇷 Français🇩🇪 Deutsch🇪🇸 Español🇮🇹 Italiano

Real estate price map


Real estate price map in the municipality of Uchaud, choose a section to see transactions by parcel.

Gard (30)

Uchaud - Real estate price m²

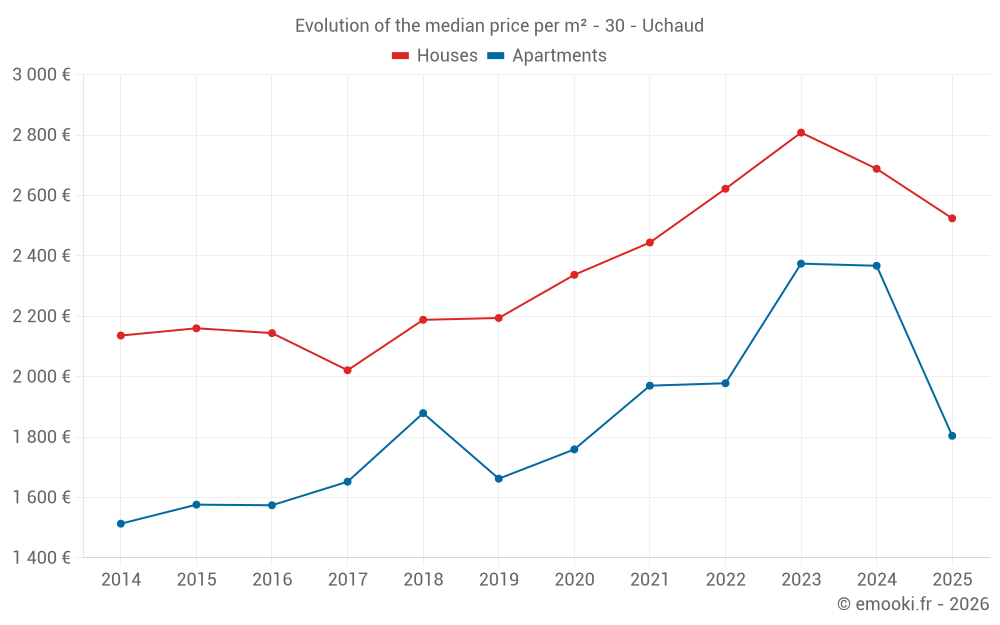
Median price of real estate
in the municipality of Uchaud

HousesHouses
2 548  /m²
1-23-45-67-89-10
Reliability 8/10
Median price on the 39 transactions of the last 12 months.
from 2 047 to
3 190  /m²
60% of transactions from the 2nd to the 8th deciles.
ApartmentsApartments
2 367  /m²
1-23-45-67-89-10
Reliability 7/10
Median price on the 21 transactions of the last 24 months.
from 1 636 to
2 766  /m²
60% of transactions from the 2nd to the 8th deciles.
DwellingsDwellings
2 425  /m²
1-23-45-67-89-10
Reliability 9/10
Median price on the 21 transactions of the last 6 months.
from 1 636 to
2 717  /m²
60% of transactions from the 2nd to the 8th deciles.
HousesEvolution of the price per m² of houses since...
1 year
-6.1%
2 years
-10%
3 years
-3.7%
4 years
+3.3%
5 years
+8%
6 years
+15%
7 years
+15%
8 years
+25%
9 years
+18%
10 years
+17%
11 years
+18%
The price per m² of houses has decreased by 10% since 2 years, but it has increased by 25% in 8 years.
ApartmentsEvolution of the price per m² of apartments since...
1 year
-24%
2 years
-24%
3 years
-8.8%
4 years
-8.4%
5 years
+2.6%
6 years
+8.5%
7 years
-4%
8 years
+9.2%
9 years
+15%
10 years
+14%
11 years
+19%
The price per m² of apartments has decreased by 24% since 2 years, but it has increased by 19% in 11 years.

Yearly evolution

Evolution of the median price per m²

Evolution of the median price per m² - 30 - Uchaud

Evolution of the number of transactions

Warning, last year incomplete. Projections made based on the proportions between semesters of the previous year at the departmental/national level and by type of property.

Evolution of the number of transactions - 30 - Uchaud

Yearly data

Descending order
Year
Houses
house
transactions
Houses
house
Price per m²
Apartments
apt.
transactions
Apartments
apt.
Price per m²
2025
13
2 524 
8
1 804 
2024
43
2 688 
7
2 367 
2023
42
2 808 
12
2 374 
2022
54
2 622 
18
1 978 
2021
73
2 444 
30
1 970 
2020
63
2 337 
21
1 759 
2019
44
2 194 
14
1 662 
2018
46
2 188 
12
1 879 
2017
50
2 021 
12
1 652 
2016
50
2 144 
10
1 574 
2015
43
2 160 
18
1 576 
2014
33
2 136 
11
1 513 

Analysis

Structure of prices per m²

Values of price percentiles per m² over the periods used for the estimated price of each type of property.

Structure of transaction amounts

Values of transaction amounts percentiles over the periods used for the estimated price of each type of property.

Transaction amounts and prices per m² by percentile

Ascending order
Percentile
Houses
house
Price per m²
Houses
house
Transaction amount
Apartments
apt.
Price per m²
Apartments
apt.
Transaction amount
10th percentile
1 298 
105 K
1 364 
108 K
20th percentile
2 047 
189 K
1 636 
120 K
30th percentile
2 284 
211 K
1 806 
126 K
40th percentile
2 478 
227 K
2 134 
135 K
50th percentile
2 548 
233 K
2 367 
143 K
60th percentile
2 691 
251 K
2 425 
160 K
70th percentile
2 804 
276 K
2 521 
171 K
80th percentile
3 190 
330 K
2 766 
201 K
90th percentile
3 541 
387 K
3 001 
236 K

National and departmental comparison

Evolution of the median price per m² of houses

Evolution of the median price per m² of apartments

Quarterly evolution

Evolution of the median price per m²

Evolution of the number of transactions

Quarterly data

Descending order
Quarter
Houses
house
transactions
Houses
house
Price per m²
Apartments
apt.
transactions
Apartments
apt.
Price per m²
2025 Q2
4
2 520 
4
1 500 
2025 Q1
9
2 524 
4
2 170 
2024 Q4
7
2 161 
1
2 367 
2024 Q3
19
2 688 
3
2 954 
2024 Q2
7
3 020 
2
1 860 
2024 Q1
10
2 540 
1
2 766 
2023 Q4
7
2 079 
2
2 873 
2023 Q3
12
3 265 
4
2 471 
2023 Q2
15
2 553 
4
2 225 
2023 Q1
8
2 747 
2
2 303 
2022 Q4
13
2 630 
5
1 849 
2022 Q3
15
3 029 
3
2 023 
2022 Q2
17
2 273 
8
1 910 
2022 Q1
9
2 450 
2
1 914 
2021 Q4
13
2 338 
3
1 767 
2021 Q3
22
2 678 
9
1 948 
2021 Q2
18
2 233 
10
1 948 
2021 Q1
20
2 445 
8
2 164 
2020 Q4
20
2 482 
12
1 906 
2020 Q3
11
2 258 
4
1 530 
2020 Q2
19
2 273 
3
1 748 
2020 Q1
13
2 386 
2
1 833 
2019 Q4
13
2 284 
5
1 453 
2019 Q3
13
2 183 
4
1 852 
2019 Q2
6
2 040 
4
1 550 
2019 Q1
12
2 188 
1
1 678 
2018 Q4
16
2 098 
2
1 749 
2018 Q3
8
2 608 
0
--- 
2018 Q2
12
1 900 
5
1 860 
2018 Q1
10
2 176 
5
1 915 
2017 Q4
11
2 100 
2
1 652 
2017 Q3
11
1 980 
2
2 059 
2017 Q2
14
1 809 
4
1 832 
2017 Q1
14
2 188 
4
1 115 
2016 Q4
14
2 359 
3
1 293 
2016 Q3
13
2 125 
2
1 542 
2016 Q2
10
2 032 
2
1 972 
2016 Q1
13
2 030 
3
1 571 
2015 Q4
14
2 001 
2
1 207 
2015 Q3
12
2 200 
4
1 650 
2015 Q2
7
2 319 
6
1 571 
2015 Q1
10
2 236 
6
1 750 
2014 Q4
9
2 308 
3
1 675 
2014 Q3
12
2 092 
1
1 370 
2014 Q2
6
2 272 
5
1 396 
2014 Q1
6
2 014 
2
1 406 

Overview of the latest real estate transactions

The following list is an anonymized overview of the latest transactions. For more details and to find all transactions, please use the map to view transactions by plot or the transaction search page for a search by criteria.

2025-06-13
108 000 
1 636  /m²(66 m²)
Sale
Apartments
Apartment
3 rooms
66 m2
1 outbuilding
Land
11 m2
-Sols
2025-06-11
135 000 
1 364  /m²(99 m²)
Sale
Apartments
Apartment
3 rooms
99 m2
2025-06-06
170 000 
Sale
Land
142 m2
-Sols
2025-06-05
100 000 
806  /m²(124 m²)
Sale
Apartments
Apartment
4 rooms
74 m2
Apartments
Apartment
2 rooms
50 m2
2025-05-07
11 734 
Sale
Land
345 m2
-Taillis simples
/Chênes -verts
Land
779 m2
-Taillis simples
/Chênes -verts
Land
4798 m2
-Taillis simples
/Chênes -verts
Land
4354 m2
-Taillis simples
/Chênes -verts
Land
1458 m2
-Taillis simples
/Chênes -verts
2025-04-25
100 000 
746  /m²(134 m²)
Sale
Houses
House
4 rooms
134 m2
2 outbuildings
Land
900 m2
-Sols
Land
3258 m2
-Terres
2025-04-23
237 000 
2 324  /m²(102 m²)
Sale
Houses
House
5 rooms
102 m2
Land
403 m2
-Sols
2025-04-22
143 100 
2 425  /m²(59 m²)
Sale
Apartments
Apartment
2 rooms
59 m2
Land
111 m2
-Sols
Land
364 m2
-Sols
2025-04-18
332 915 
3 397  /m²(98 m²)
Sale
Houses
House
3 rooms
98 m2
1 outbuilding
Land
763 m2
-Sols
Land
29 m2
-Sols
Land
3 m2
-Sols
2025-04-14
250 000 
2 717  /m²(92 m²)
Sale
Houses
House
5 rooms
92 m2
Land
611 m2
-Sols
2025-03-24
120 000 
1 818  /m²(66 m²)
Sale
Apartments
Apartment
3 rooms
66 m2
1 outbuilding
2025-03-24
85 000 
1 667  /m²(51 m²)
Sale
Houses
House
3 rooms
51 m2
Land
34 m2
-Sols
2025-03-18
236 400 
1 791  /m²(132 m²)
Sale
Apartments
Apartment
4 rooms
132 m2
1 outbuilding
Land
109 m2
-Sols
Land
9 m2
-Sols
Land
95 m2
-Sols
2025-03-17
327 000 
2 240  /m²(146 m²)
Sale
Houses
House
6 rooms
146 m2
1 outbuilding
Land
1781 m2
-Sols
2025-03-06
300 000 
2 521  /m²(119 m²)
Sale
Apartments
Apartment
2 rooms
72 m2
Apartments
Apartment
2 rooms
47 m2
2 outbuildings
Land
679 m2
-Sols
2025-02-28
97 000 
3 345  /m²(29 m²)
Sale
Apartments
Apartment
1 room
29 m2
1 outbuilding
2025-02-28
375 000 
3 233  /m²(116 m²)
Sale
Houses
House
6 rooms
116 m2
1 outbuilding
Land
2103 m2
-Terrains d'agrément
Land
500 m2
-Sols
2025-02-24
227 030 
1 555  /m²(146 m²)
Sale
Houses
House
3 rooms
146 m2
Land
73 m2
-Sols
Land
26 m2
-Sols
2025-02-14
1 
Exchange
Land
40 m2
-Sols
Land
26 m2
-Sols
2025-02-10
1 
Sale
Land
41 m2
-Sols
1013 transactions listed in the municipality

Gard (30)

Most expensive cities

City
name
Descending orderHouses
house
Price per m²
4 483 
4 034 
3 942 
3 835 
3 606 
3 505 
City
name
Descending orderApartments
apt.
Price per m²
5 174 
5 102 
3 626 
3 553 
3 286 
3 112 
2 994 
2 960 

Least expensive cities

City
name
Ascending orderHouses
house
Price per m²
838 
846 
988 
1 057 
1 135 
1 140 
1 216 
1 226 
City
name
Ascending orderApartments
apt.
Price per m²
188 
208 
300 
340 
438 
558 
600