emooki
HomePrice mapTransactions
🇬🇧 English🇫🇷 Français🇩🇪 Deutsch🇪🇸 Español🇮🇹 Italiano

Real estate price map


Real estate price map in the municipality of Codognan, choose a section to see transactions by parcel.

Gard (30)

Codognan - Real estate price m²

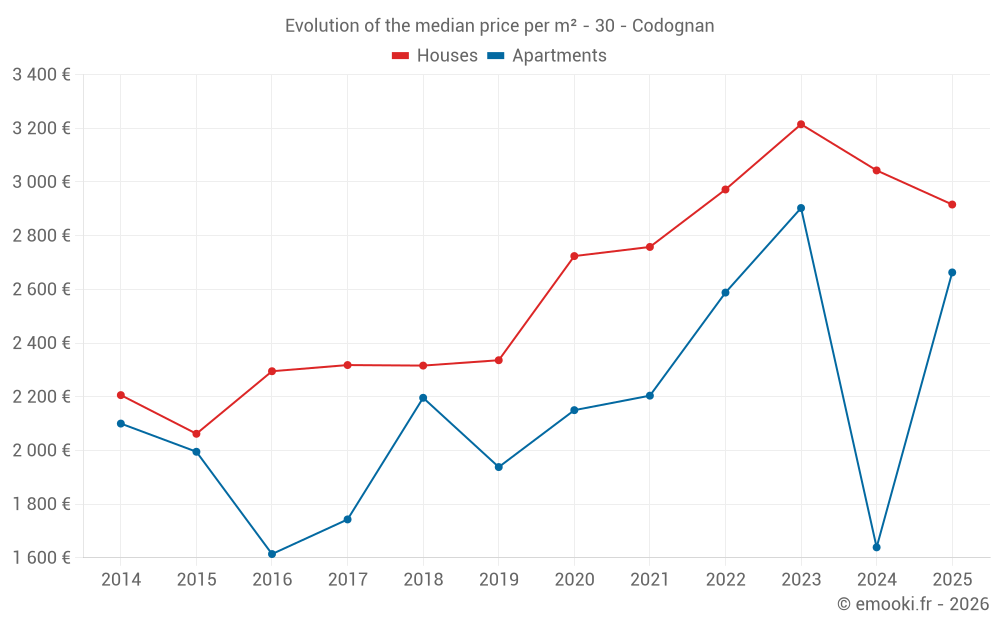
Median price of real estate
in the municipality of Codognan

HousesHouses
2 959  /m²
1-23-45-67-89-10
Reliability 8/10
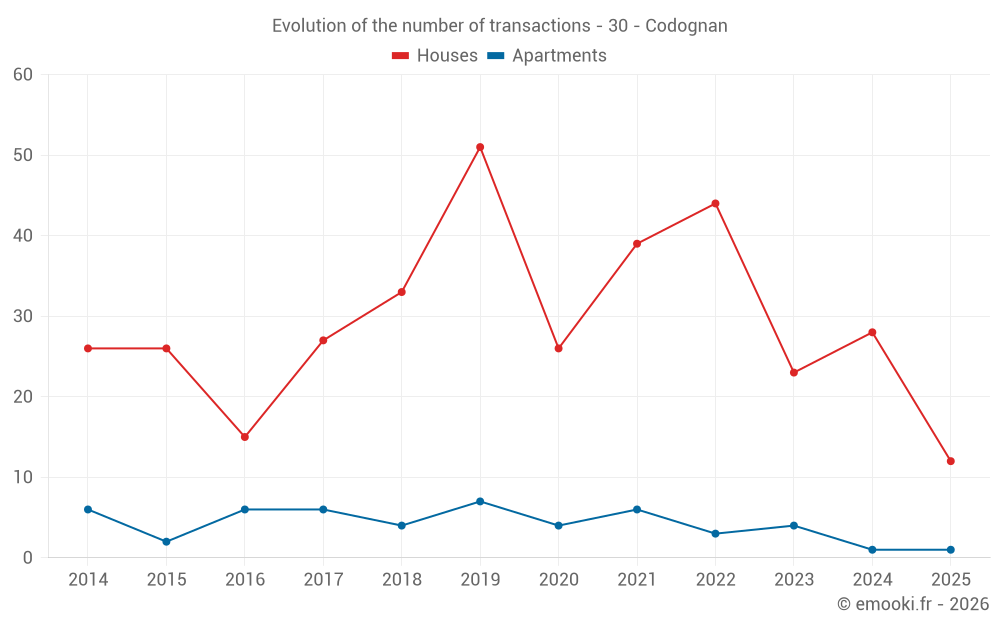
Median price on the 25 transactions of the last 12 months.
from 2 333 to
3 527  /m²
60% of transactions from the 2nd to the 8th deciles.
ApartmentsApartments
2 445  /m²
1-23-45-67-89-10
Reliability 5/10
Median price on the 13 transactions of the last 48 months.
from 2 179 to
2 785  /m²
60% of transactions from the 2nd to the 8th deciles.
DwellingsDwellings
2 950  /m²
1-23-45-67-89-10
Reliability 8/10
Median price on the 27 transactions of the last 12 months.
from 2 217 to
3 476  /m²
60% of transactions from the 2nd to the 8th deciles.
HousesEvolution of the price per m² of houses since...
1 year
-4.2%
2 years
-9.3%
3 years
-1.9%
4 years
+5.7%
5 years
+7%
6 years
+25%
7 years
+26%
8 years
+26%
9 years
+27%
10 years
+41%
11 years
+32%
The price per m² of houses has decreased by 9.3% since 2 years, but it has increased by 41% in 10 years.

Yearly evolution

Evolution of the median price per m²

Evolution of the median price per m² - 30 - Codognan

Evolution of the number of transactions

Warning, last year incomplete. Projections made based on the proportions between semesters of the previous year at the departmental/national level and by type of property.

Evolution of the number of transactions - 30 - Codognan

Yearly data

Descending order
Year
Houses
house
transactions
Houses
house
Price per m²
Apartments
apt.
transactions
Apartments
apt.
Price per m²
2025
12
2 916 
1
2 663 
2024
28
3 043 
1
1 639 
2023
23
3 215 
4
2 903 
2022
44
2 972 
3
2 588 
2021
39
2 758 
6
2 204 
2020
26
2 724 
4
2 150 
2019
51
2 336 
7
1 938 
2018
33
2 316 
4
2 196 
2017
27
2 318 
6
1 743 
2016
15
2 295 
6
1 614 
2015
26
2 062 
2
1 995 
2014
26
2 206 
6
2 100 

Analysis

Structure of prices per m²

Values of price percentiles per m² over the periods used for the estimated price of each type of property.

Structure of transaction amounts

Values of transaction amounts percentiles over the periods used for the estimated price of each type of property.

Transaction amounts and prices per m² by percentile

Ascending order
Percentile
Houses
house
Price per m²
Houses
house
Transaction amount
Apartments
apt.
Price per m²
Apartments
apt.
Transaction amount
10th percentile
1 793 
164 K
1 989 
78 751 
20th percentile
2 333 
199 K
2 179 
115 K
30th percentile
2 718 
214 K
2 208 
137 K
40th percentile
2 860 
244 K
2 357 
143 K
50th percentile
2 959 
315 K
2 445 
164 K
60th percentile
3 110 
326 K
2 603 
185 K
70th percentile
3 314 
333 K
2 669 
196 K
80th percentile
3 527 
342 K
2 785 
198 K
90th percentile
3 733 
373 K
3 073 
400 K

National and departmental comparison

Evolution of the median price per m² of houses

Evolution of the median price per m² of apartments

Quarterly evolution

Evolution of the median price per m²

Evolution of the number of transactions

Quarterly data

Descending order
Quarter
Houses
house
transactions
Houses
house
Price per m²
Apartments
apt.
transactions
Apartments
apt.
Price per m²
2025 Q2
5
3 083 
0
--- 
2025 Q1
7
2 838 
1
2 663 
2024 Q4
6
3 550 
1
1 639 
2024 Q3
7
2 950 
0
--- 
2024 Q2
6
2 845 
0
--- 
2024 Q1
9
3 520 
0
--- 
2023 Q4
6
3 082 
1
4 463 
2023 Q3
8
3 508 
1
3 127 
2023 Q2
7
3 109 
0
--- 
2023 Q1
2
3 094 
2
2 535 
2022 Q4
10
3 568 
0
--- 
2022 Q3
13
3 036 
0
--- 
2022 Q2
11
2 890 
1
2 588 
2022 Q1
10
2 924 
2
2 650 
2021 Q4
4
2 930 
1
2 172 
2021 Q3
14
2 802 
3
2 189 
2021 Q2
9
2 654 
0
--- 
2021 Q1
12
2 920 
2
2 478 
2020 Q4
7
2 833 
2
2 150 
2020 Q3
5
2 997 
1
1 233 
2020 Q2
7
2 191 
0
--- 
2020 Q1
7
2 667 
1
2 568 
2019 Q4
15
2 328 
1
2 029 
2019 Q3
13
2 524 
1
949 
2019 Q2
11
2 011 
4
2 012 
2019 Q1
12
2 339 
1
1 866 
2018 Q4
12
2 524 
2
2 204 
2018 Q3
10
2 428 
1
2 343 
2018 Q2
5
2 000 
0
--- 
2018 Q1
6
1 530 
1
1 971 
2017 Q4
8
2 440 
1
1 761 
2017 Q3
6
2 482 
2
2 013 
2017 Q2
5
2 318 
1
1 716 
2017 Q1
8
2 000 
2
1 880 
2016 Q4
3
1 726 
4
1 614 
2016 Q3
6
2 439 
0
--- 
2016 Q2
4
2 296 
2
1 323 
2016 Q1
2
2 390 
0
--- 
2015 Q4
5
2 193 
2
1 995 
2015 Q3
7
2 198 
0
--- 
2015 Q2
9
1 991 
0
--- 
2015 Q1
5
2 337 
0
--- 
2014 Q4
3
2 382 
0
--- 
2014 Q3
6
2 262 
2
2 100 
2014 Q2
8
2 146 
1
2 289 
2014 Q1
9
1 800 
3
1 838 

Overview of the latest real estate transactions

The following list is an anonymized overview of the latest transactions. For more details and to find all transactions, please use the map to view transactions by plot or the transaction search page for a search by criteria.

2025-06-26
3 870 
Sale
Land
223 m2
-Terres
2025-05-23
250 000 
2 874  /m²(87 m²)
Sale
Houses
House
5 rooms
87 m2
1 outbuilding
Land
534 m2
-Jardins
/Jardin potager
Land
528 m2
-Sols
2025-05-23
325 440 
2 604  /m²(125 m²)
Sale
Houses
House
5 rooms
125 m2
Land
136 m2
-Sols
2025-05-22
267 500 
1 178  /m²(227 m²)
5 459  /m²(49 m²)
Sale
Houses
House
3 rooms
49 m2
Commercial property
178 m2
Land
188 m2
-Sols
2025-05-15
431 630 
3 083  /m²(140 m²)
Sale
Houses
House
6 rooms
140 m2
1 outbuilding
Land
428 m2
-Sols
2025-05-07
5 000 
2  /m²(2541 m²)
Exchange
Commercial property
281 m2
Commercial property
1900 m2
Commercial property
360 m2
Land
185 m2
-Sols
Land
1322 m2
-Sols
Land
137 m2
-Sols
Land
10 m2
-Sols
2025-05-07
317 992 
3 741  /m²(85 m²)
Sale
Houses
House
3 rooms
85 m2
1 outbuilding
Land
413 m2
-Sols
2025-05-07
5 000 
Sale
Land
490 m2
-Sols
2025-04-30
100 000 
Sale
Land
374 m2
-Sols
2025-04-30
315 000 
3 150  /m²(100 m²)
Sale
Houses
House
4 rooms
100 m2
Land
391 m2
-Sols
2025-03-26
313 700 
2 959  /m²(106 m²)
Sale
Houses
House
5 rooms
106 m2
Land
840 m2
-Sols
2025-03-25
210 000 
2 838  /m²(74 m²)
Sale
Houses
House
3 rooms
74 m2
Land
349 m2
-Sols
2025-03-14
350 000 
3 500  /m²(100 m²)
Sale
Houses
House
4 rooms
100 m2
Land
545 m2
-Sols
2025-03-11
110 000 
1 833  /m²(60 m²)
Sale
Commercial property
60 m2
Land
53 m2
-Sols
2025-03-07
340 000 
2 179  /m²(156 m²)
Sale
Houses
House
5 rooms
156 m2
Land
638 m2
-Sols
2025-03-04
26 115 
Sale
Land
18544 m2
-Terres
2025-02-27
6 552 
Sale
Land
2313 m2
-Terres
Land
1760 m2
-Terres
2025-02-20
175 000 
Sale
2 outbuildings
Land
80 m2
-Sols
2025-02-19
75 000 
1 875  /m²(40 m²)
Sale
Houses
House
1 room
40 m2
Land
34 m2
-Sols
2025-02-18
595 000 
848  /m²(702 m²)
4 577  /m²(130 m²)
Sale
Houses
House
6 rooms
130 m2
Commercial property
572 m2
Land
1653 m2
-Sols
672 transactions listed in the municipality

Gard (30)

Most expensive cities

City
name
Descending orderHouses
house
Price per m²
4 483 
4 034 
3 942 
3 835 
3 606 
3 505 
City
name
Descending orderApartments
apt.
Price per m²
5 174 
5 102 
3 626 
3 553 
3 286 
3 112 
2 994 
2 960 

Least expensive cities

City
name
Ascending orderHouses
house
Price per m²
838 
846 
988 
1 057 
1 135 
1 140 
1 216 
1 226 
City
name
Ascending orderApartments
apt.
Price per m²
188 
208 
300 
340 
438 
558 
600