emooki
HomePrice mapTransactions
🇬🇧 English🇫🇷 Français🇩🇪 Deutsch🇪🇸 Español🇮🇹 Italiano

Real estate price map


Real estate price map in the municipality of Trèves.

Gard (30)
Trèves

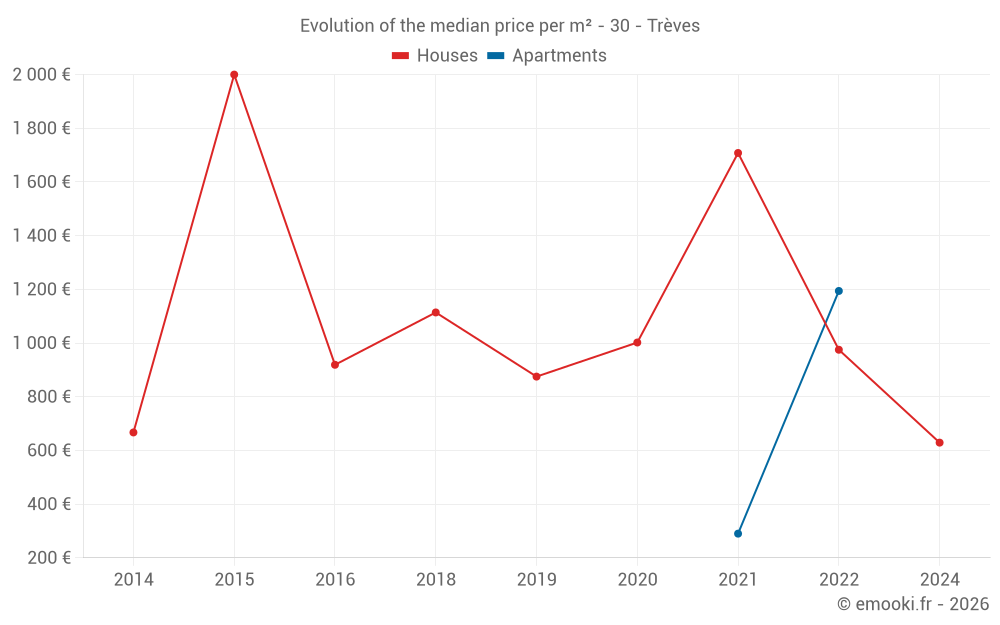
Median price of real estate
in the municipality of Trèves

HousesHouses
988  /m²
1-23-45-67-89-10
Reliability 4/10
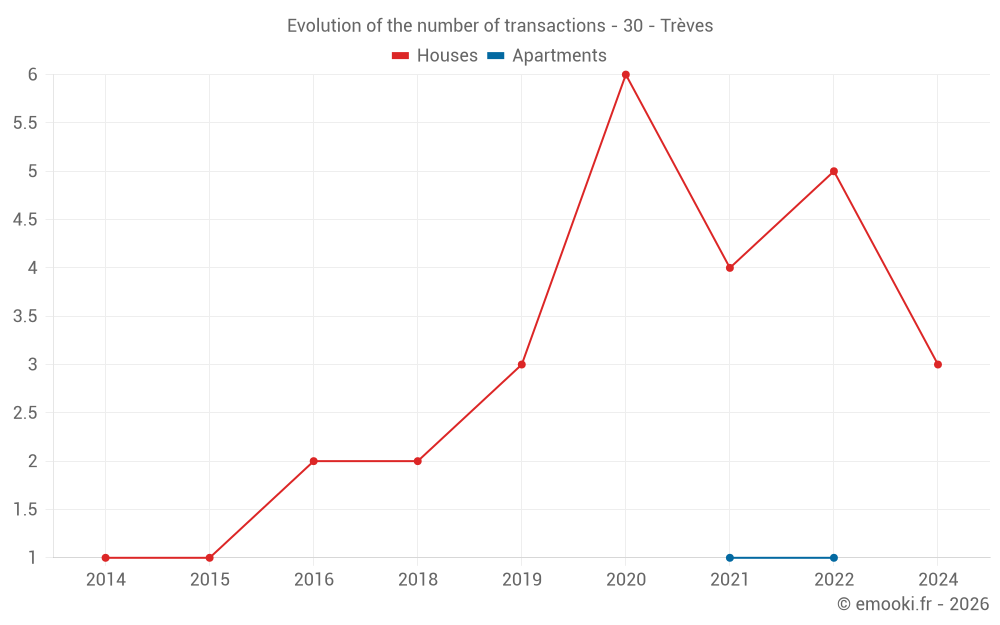
Median price on the 14 transactions of the last 60 months.
from 702 to
1 660  /m²
60% of transactions from the 2nd to the 8th deciles.
ApartmentsApartments
742  /m²
1-23-45-67-89-10
Reliability 1/10
Median price on the 2 transactions of the last 120 months.
DwellingsDwellings
816  /m²
1-23-45-67-89-10
Reliability 5/10
Median price on the 10 transactions of the last 48 months.
HousesEvolution of the price per m² of houses since...
1 year
--
2 years
--
3 years
--
4 years
--
5 years
--
6 years
--
7 years
--
8 years
--
9 years
--
10 years
--
11 years
--
ApartmentsEvolution of the price per m² of apartments since...
1 year
--
2 years
--
3 years
--
4 years
--
5 years
--
6 years
--
7 years
--
8 years
--
9 years
--
10 years
--
11 years
--

Yearly evolution

Evolution of the median price per m²

Evolution of the number of transactions

Warning, last year incomplete.

Yearly data

Descending order
Year
Houses
house
transactions
Houses
house
Price per m²
Apartments
apt.
transactions
Apartments
apt.
Price per m²
2025
0
--- 
0
--- 
2024
3
629 
0
--- 
2023
0
--- 
0
--- 
2022
5
975 
1
1 194 
2021
4
1 708 
1
290 
2020
6
1 002 
0
--- 
2019
3
875 
0
--- 
2018
2
1 114 
0
--- 
2017
0
--- 
0
--- 
2016
2
919 
0
--- 
2015
1
2 000 
0
--- 
2014
1
667 
0
--- 

Analysis

Structure of prices per m²

Values of price percentiles per m² over the periods used for the estimated price of each type of property.

Structure of transaction amounts

Values of transaction amounts percentiles over the periods used for the estimated price of each type of property.

Transaction amounts and prices per m² by percentile

Ascending order
Percentile
Houses
house
Price per m²
Houses
house
Transaction amount
Apartments
apt.
Price per m²
Apartments
apt.
Transaction amount
10th percentile
352 
21 050 
380 
26 000 
20th percentile
702 
38 400 
471 
32 000 
30th percentile
793 
39 900 
561 
38 000 
40th percentile
861 
41 720 
652 
44 000 
50th percentile
988 
47 500 
742 
50 000 
60th percentile
1 114 
52 400 
832 
56 000 
70th percentile
1 184 
73 000 
923 
62 000 
80th percentile
1 660 
106 K
1 013 
68 000 
90th percentile
2 125 
142 K
1 104 
74 000 

National and departmental comparison

Evolution of the median price per m² of houses

Evolution of the median price per m² of apartments

Quarterly evolution

Evolution of the median price per m²

Evolution of the number of transactions

Quarterly data

Descending order
Quarter
Houses
house
transactions
Houses
house
Price per m²
Apartments
apt.
transactions
Apartments
apt.
Price per m²
2024 Q3
2
731 
0
--- 
2024 Q1
1
233 
0
--- 
2022 Q4
2
774 
0
--- 
2022 Q3
2
1 076 
0
--- 
2022 Q2
1
975 
1
1 194 
2021 Q3
0
--- 
1
290 
2021 Q2
1
1 949 
0
--- 
2021 Q1
3
1 467 
0
--- 
2020 Q4
2
1 791 
0
--- 
2020 Q2
2
615 
0
--- 
2020 Q1
2
1 010 
0
--- 
2019 Q4
2
908 
0
--- 
2019 Q2
1
303 
0
--- 
2018 Q4
2
1 114 
0
--- 
2016 Q4
1
1 088 
0
--- 
2016 Q2
1
750 
0
--- 
2015 Q2
1
2 000 
0
--- 
2014 Q4
1
667 
0
--- 

Gard (30)

Most expensive cities

City
name
Descending orderHouses
house
Price per m²
4 483 
4 034 
3 942 
3 835 
3 606 
3 505 
City
name
Descending orderApartments
apt.
Price per m²
5 174 
5 102 
3 626 
3 553 
3 286 
3 112 
2 994 
2 960 

Least expensive cities

City
name
Ascending orderHouses
house
Price per m²
838 
846 
988 
1 057 
1 135 
1 140 
1 216 
1 226 
City
name
Ascending orderApartments
apt.
Price per m²
188 
208 
300 
340 
438 
558 
600