emooki
HomePrice mapTransactions
🇬🇧 English🇫🇷 Français🇩🇪 Deutsch🇪🇸 Español🇮🇹 Italiano

Real estate price map


Real estate price map in the municipality of Bernis, choose a section to see transactions by parcel.

Gard (30)

Bernis - Real estate price m²

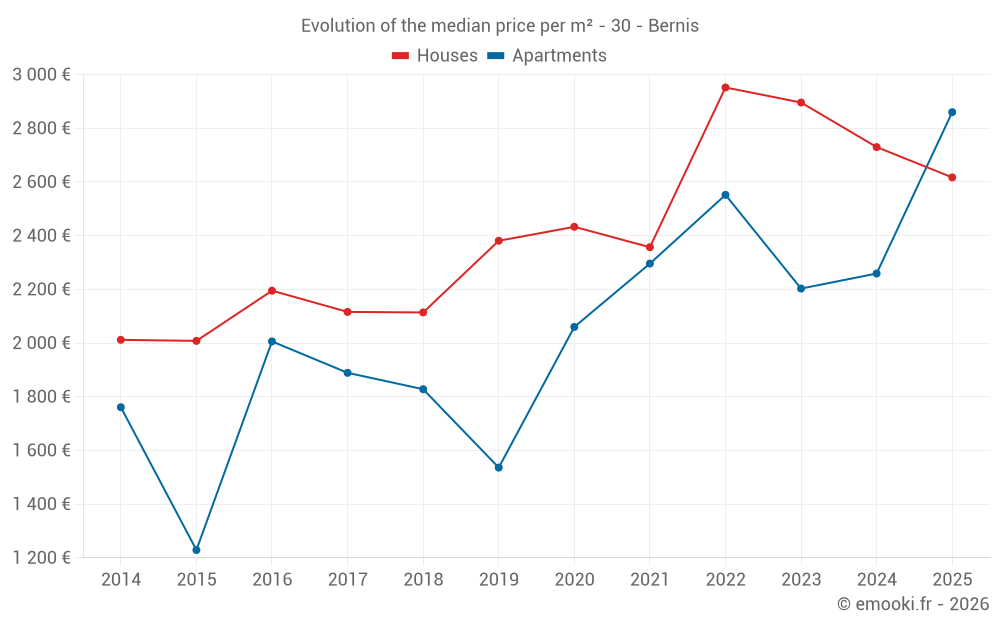
Median price of real estate
in the municipality of Bernis

HousesHouses
2 690  /m²
1-23-45-67-89-10
Reliability 8/10
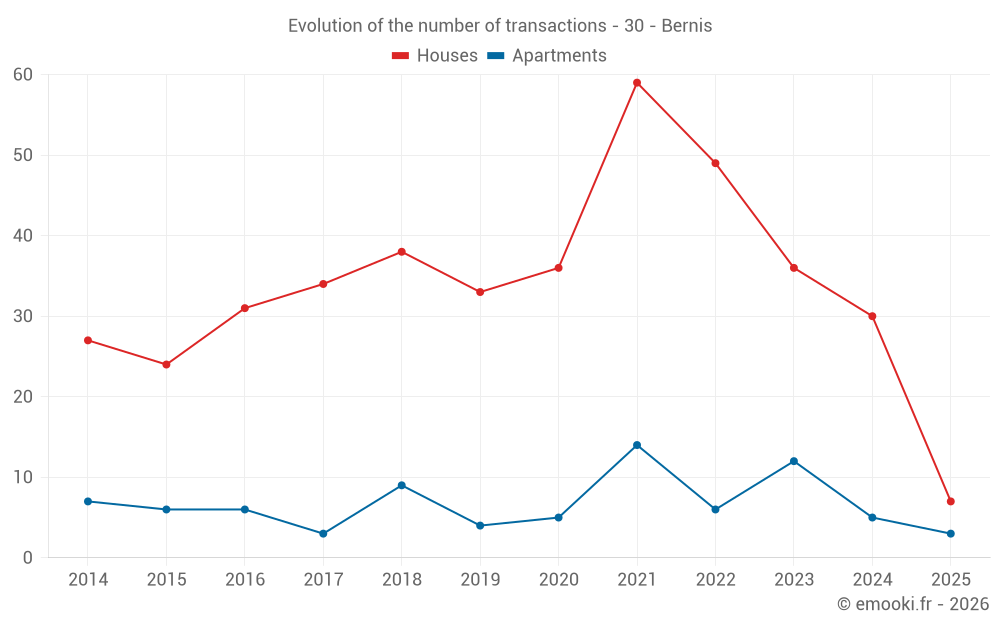
Median price on the 20 transactions of the last 12 months.
from 2 099 to
3 220  /m²
60% of transactions from the 2nd to the 8th deciles.
ApartmentsApartments
2 342  /m²
1-23-45-67-89-10
Reliability 6/10
Median price on the 23 transactions of the last 36 months.
from 1 754 to
2 797  /m²
60% of transactions from the 2nd to the 8th deciles.
DwellingsDwellings
2 690  /m²
1-23-45-67-89-10
Reliability 8/10
Median price on the 24 transactions of the last 12 months.
from 2 201 to
3 152  /m²
60% of transactions from the 2nd to the 8th deciles.
HousesEvolution of the price per m² of houses since...
1 year
-4.1%
2 years
-10%
3 years
-11%
4 years
+11%
5 years
+7.6%
6 years
+10%
7 years
+24%
8 years
+24%
9 years
+19%
10 years
+30%
11 years
+30%
The price per m² of houses has decreased by 11% since 3 years, but it has increased by 30% in 10 years.

Yearly evolution

Evolution of the median price per m²

Evolution of the median price per m² - 30 - Bernis

Evolution of the number of transactions

Warning, last year incomplete. Projections made based on the proportions between semesters of the previous year at the departmental/national level and by type of property.

Evolution of the number of transactions - 30 - Bernis

Yearly data

Descending order
Year
Houses
house
transactions
Houses
house
Price per m²
Apartments
apt.
transactions
Apartments
apt.
Price per m²
2025
7
2 617 
3
2 860 
2024
30
2 730 
5
2 259 
2023
36
2 896 
12
2 203 
2022
49
2 952 
6
2 552 
2021
59
2 357 
14
2 296 
2020
36
2 433 
5
2 060 
2019
33
2 381 
4
1 536 
2018
38
2 114 
9
1 828 
2017
34
2 116 
3
1 889 
2016
31
2 195 
6
2 006 
2015
24
2 008 
6
1 229 
2014
27
2 012 
7
1 761 

Analysis

Structure of prices per m²

Values of price percentiles per m² over the periods used for the estimated price of each type of property.

Structure of transaction amounts

Values of transaction amounts percentiles over the periods used for the estimated price of each type of property.

Transaction amounts and prices per m² by percentile

Ascending order
Percentile
Houses
house
Price per m²
Houses
house
Transaction amount
Apartments
apt.
Price per m²
Apartments
apt.
Transaction amount
10th percentile
1 859 
160 K
1 263 
114 K
20th percentile
2 099 
191 K
1 754 
132 K
30th percentile
2 475 
232 K
1 964 
136 K
40th percentile
2 625 
254 K
2 227 
153 K
50th percentile
2 690 
261 K
2 342 
163 K
60th percentile
2 798 
304 K
2 442 
173 K
70th percentile
3 076 
313 K
2 651 
182 K
80th percentile
3 220 
342 K
2 797 
219 K
90th percentile
3 726 
395 K
2 963 
271 K

National and departmental comparison

Evolution of the median price per m² of houses

Evolution of the median price per m² of apartments

Quarterly evolution

Evolution of the median price per m²

Evolution of the number of transactions

Quarterly data

Descending order
Quarter
Houses
house
transactions
Houses
house
Price per m²
Apartments
apt.
transactions
Apartments
apt.
Price per m²
2025 Q2
4
2 253 
1
2 860 
2025 Q1
3
3 365 
2
2 782 
2024 Q4
7
2 760 
0
--- 
2024 Q3
6
2 942 
1
2 259 
2024 Q2
10
2 487 
4
2 030 
2024 Q1
7
2 667 
0
--- 
2023 Q4
7
3 036 
4
2 203 
2023 Q3
8
2 770 
1
1 340 
2023 Q2
8
2 608 
4
2 124 
2023 Q1
13
2 642 
3
2 460 
2022 Q4
10
2 854 
1
2 404 
2022 Q3
16
2 803 
2
2 538 
2022 Q2
7
3 051 
3
2 700 
2022 Q1
16
3 114 
0
--- 
2021 Q4
18
2 670 
5
2 451 
2021 Q3
18
2 488 
6
2 326 
2021 Q2
13
2 222 
2
1 586 
2021 Q1
10
1 992 
1
1 083 
2020 Q4
13
2 396 
0
--- 
2020 Q3
9
2 670 
2
2 300 
2020 Q2
7
2 284 
2
1 696 
2020 Q1
7
2 410 
1
1 272 
2019 Q4
8
2 704 
3
1 224 
2019 Q3
11
2 368 
0
--- 
2019 Q2
4
2 466 
1
1 930 
2019 Q1
10
2 282 
0
--- 
2018 Q4
7
2 163 
2
1 822 
2018 Q3
9
2 089 
3
2 070 
2018 Q2
11
2 062 
2
1 748 
2018 Q1
11
2 138 
2
1 744 
2017 Q4
8
2 295 
0
--- 
2017 Q3
6
2 334 
1
1 912 
2017 Q2
13
1 817 
1
1 889 
2017 Q1
7
1 938 
1
1 734 
2016 Q4
12
2 208 
2
1 626 
2016 Q3
8
2 068 
2
2 226 
2016 Q2
5
2 370 
0
--- 
2016 Q1
6
2 229 
2
2 080 
2015 Q4
10
2 048 
1
1 325 
2015 Q3
5
2 303 
2
1 866 
2015 Q2
4
2 636 
3
637 
2015 Q1
5
1 429 
0
--- 
2014 Q4
4
1 875 
5
1 716 
2014 Q3
7
1 922 
0
--- 
2014 Q2
9
2 038 
2
1 902 
2014 Q1
7
2 379 
0
--- 

Overview of the latest real estate transactions

The following list is an anonymized overview of the latest transactions. For more details and to find all transactions, please use the map to view transactions by plot or the transaction search page for a search by criteria.

2025-05-26
145 043 
2 014  /m²(72 m²)
Sale
Commercial property
72 m2
4 outbuildings
2025-05-21
10 000 
Sale
Land
500 m2
-Sols
Land
870 m2
-Vergers
/Oliveraie ou oliviers
Land
500 m2
-Landes
2025-05-20
60 000 
Sale
Land
400 m2
-Terres
2025-05-19
410 900 
2 617  /m²(157 m²)
Sale
Houses
House
5 rooms
157 m2
2 outbuildings
Land
453 m2
-Sols
Land
93 m2
-Sols
2025-04-29
255 000 
1 889  /m²(135 m²)
Sale
Houses
House
4 rooms
135 m2
Land
181 m2
-Sols
2025-04-29
200 000 
1 282  /m²(156 m²)
Sale
Houses
House
5 rooms
156 m2
Land
173 m2
-Sols
2025-04-22
260 000 
2 680  /m²(97 m²)
Sale
Houses
House
5 rooms
97 m2
Land
811 m2
-Sols
2025-04-18
163 000 
2 860  /m²(57 m²)
Sale
Apartments
Apartment
3 rooms
57 m2
1 outbuilding
2025-03-26
311 050 
3 703  /m²(84 m²)
Sale
Houses
House
4 rooms
84 m2
2 outbuildings
Land
604 m2
-Sols
Land
608 m2
-Jardins
/Jardin potager
2025-03-24
82 500 
1 587  /m²(52 m²)
Sale
Houses
House
3 rooms
52 m2
Land
118 m2
-Sols
2025-03-21
23 408 
Sale
Land
16720 m2
-Terres
2025-03-20
228 000 
Sale
Land
13 m2
-Sols
Land
326 m2
-Sols
Land
162 m2
-Sols
Land
343 m2
-Sols
2025-03-20
228 000 
Sale
Land
13 m2
-Sols
Land
326 m2
-Sols
Land
184 m2
-Sols
Land
343 m2
-Sols
2025-03-18
138 000 
2 654  /m²(52 m²)
Sale
Apartments
Apartment
3 rooms
52 m2
1 outbuilding
2025-03-03
14 000 
Sale
Land
1070 m2
-Terres
Land
613 m2
-Terres
2025-02-14
235 590 
2 909  /m²(81 m²)
Sale
Apartments
Apartment
4 rooms
81 m2
1 outbuilding
Land
247 m2
-Sols
2025-01-20
40 000 
Sale
Land
4683 m2
-Terres
/Légumière de plein champ
2025-01-06
312 930 
3 365  /m²(93 m²)
Sale
Houses
House
3 rooms
93 m2
Land
139 m2
-Sols
2025-01-03
198 108 
Sale
Land
13 m2
-Sols
Land
326 m2
-Sols
Land
272 m2
-Sols
Land
343 m2
-Sols
2024-12-31
840 000 
2 593  /m²(324 m²)
Sale
Houses
House
3 rooms
85 m2
Houses
House
3 rooms
85 m2
Land
702 m2
-Sols
Land
28 m2
-Sols
Houses
House
4 rooms
77 m2
Houses
House
4 rooms
77 m2
Land
361 m2
-Sols
756 transactions listed in the municipality

Gard (30)

Most expensive cities

City
name
Descending orderHouses
house
Price per m²
4 483 
4 034 
3 942 
3 835 
3 606 
3 505 
City
name
Descending orderApartments
apt.
Price per m²
5 174 
5 102 
3 626 
3 553 
3 286 
3 112 
2 994 
2 960 

Least expensive cities

City
name
Ascending orderHouses
house
Price per m²
838 
846 
988 
1 057 
1 135 
1 140 
1 216 
1 226 
City
name
Ascending orderApartments
apt.
Price per m²
188 
208 
300 
340 
438 
558 
600