emooki
HomePrice mapTransactions
🇬🇧 English🇫🇷 Français🇩🇪 Deutsch🇪🇸 Español🇮🇹 Italiano

Real estate price map


Real estate price map in the municipality of Saint-Quentin-la-Poterie, choose a section to see transactions by parcel.

Gard (30)

Saint-Quentin-la-Poterie - Real estate price m²

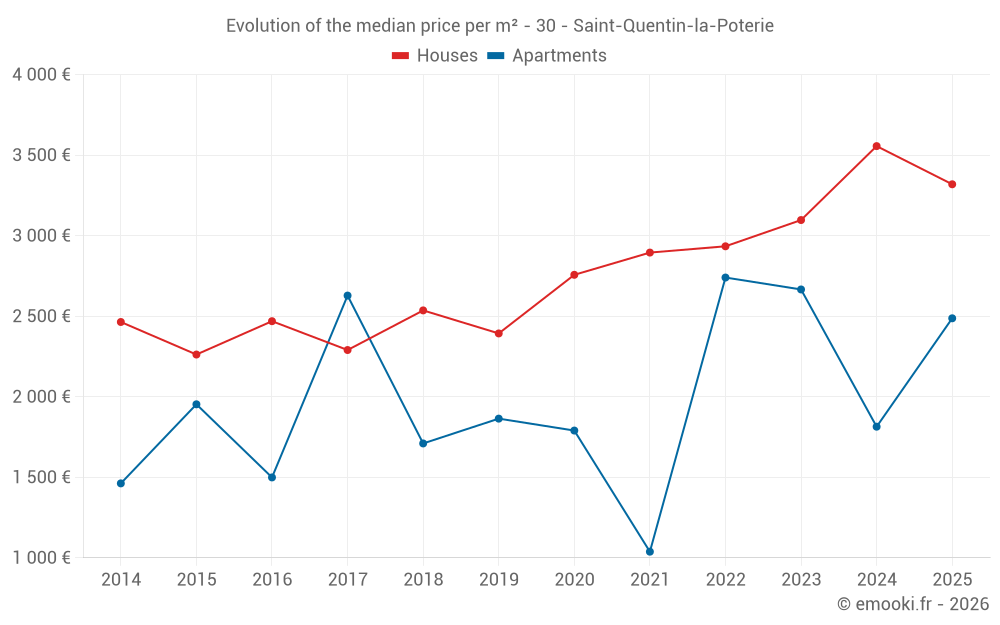
Median price of real estate
in the municipality of Saint-Quentin-la-Poterie

HousesHouses
3 310  /m²
1-23-45-67-89-10
Reliability 8/10
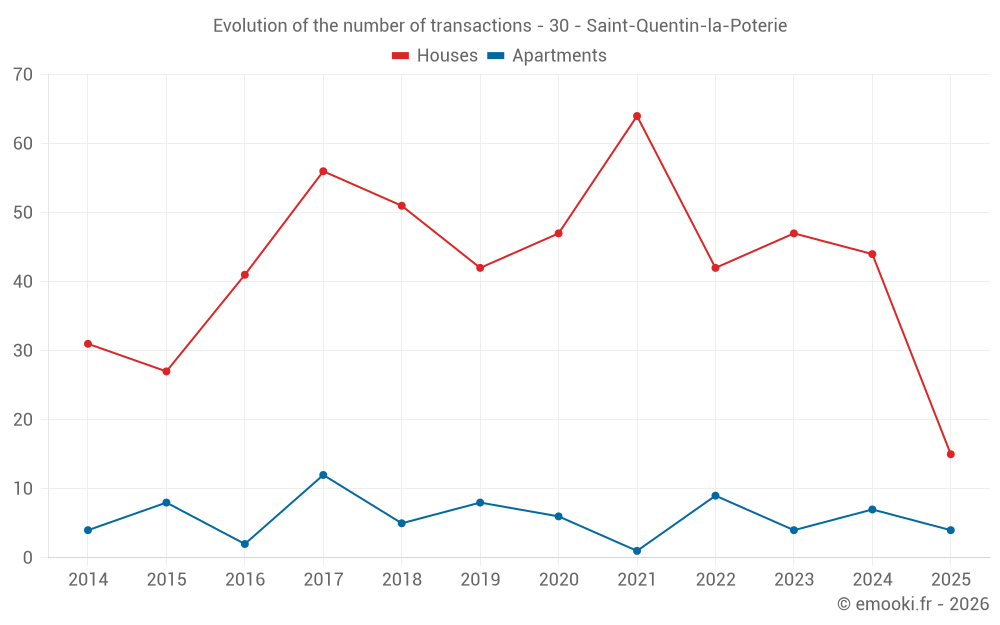
Median price on the 40 transactions of the last 12 months.
from 2 681 to
3 980  /m²
60% of transactions from the 2nd to the 8th deciles.
ApartmentsApartments
2 460  /m²
1-23-45-67-89-10
Reliability 7/10
Median price on the 14 transactions of the last 24 months.
from 1 770 to
3 011  /m²
60% of transactions from the 2nd to the 8th deciles.
DwellingsDwellings
3 284  /m²
1-23-45-67-89-10
Reliability 9/10
Median price on the 19 transactions of the last 6 months.
from 2 447 to
3 750  /m²
60% of transactions from the 2nd to the 8th deciles.
HousesEvolution of the price per m² of houses since...
1 year
-6.7%
2 years
+7.2%
3 years
+13%
4 years
+15%
5 years
+20%
6 years
+39%
7 years
+31%
8 years
+45%
9 years
+34%
10 years
+47%
11 years
+35%
The price per m² of houses has decreased by 6.7% since 1 year, but it has increased by 47% in 10 years.
ApartmentsEvolution of the price per m² of apartments since...
1 year
+37%
2 years
-6.7%
3 years
-9.2%
4 years
--
5 years
+39%
6 years
+33%
7 years
+45%
8 years
-5.4%
9 years
--
10 years
+27%
11 years
+70%
The price per m² of apartments has decreased by 9.2% since 3 years, but it has increased by 70% in 11 years.

Yearly evolution

Evolution of the median price per m²

Evolution of the median price per m² - 30 - Saint-Quentin-la-Poterie

Evolution of the number of transactions

Warning, last year incomplete. Projections made based on the proportions between semesters of the previous year at the departmental/national level and by type of property.

Evolution of the number of transactions - 30 - Saint-Quentin-la-Poterie

Yearly data

Descending order
Year
Houses
house
transactions
Houses
house
Price per m²
Apartments
apt.
transactions
Apartments
apt.
Price per m²
2025
15
3 319 
4
2 487 
2024
44
3 556 
7
1 814 
2023
47
3 097 
4
2 666 
2022
42
2 934 
9
2 740 
2021
64
2 895 
1
1 038 
2020
47
2 757 
6
1 790 
2019
42
2 393 
8
1 864 
2018
51
2 536 
5
1 710 
2017
56
2 290 
12
2 628 
2016
41
2 469 
2
1 499 
2015
27
2 262 
8
1 953 
2014
31
2 464 
4
1 462 

Analysis

Structure of prices per m²

Values of price percentiles per m² over the periods used for the estimated price of each type of property.

Structure of transaction amounts

Values of transaction amounts percentiles over the periods used for the estimated price of each type of property.

Transaction amounts and prices per m² by percentile

Ascending order
Percentile
Houses
house
Price per m²
Houses
house
Transaction amount
Apartments
apt.
Price per m²
Apartments
apt.
Transaction amount
10th percentile
2 406 
198 K
1 544 
122 K
20th percentile
2 681 
239 K
1 770 
139 K
30th percentile
2 756 
266 K
2 177 
162 K
40th percentile
2 992 
297 K
2 260 
181 K
50th percentile
3 310 
331 K
2 460 
186 K
60th percentile
3 416 
370 K
2 563 
205 K
70th percentile
3 747 
406 K
2 815 
253 K
80th percentile
3 980 
460 K
3 011 
279 K
90th percentile
4 578 
540 K
3 281 
340 K

National and departmental comparison

Evolution of the median price per m² of houses

Evolution of the median price per m² of apartments

Quarterly evolution

Evolution of the median price per m²

Evolution of the number of transactions

Quarterly data

Descending order
Quarter
Houses
house
transactions
Houses
house
Price per m²
Apartments
apt.
transactions
Apartments
apt.
Price per m²
2025 Q2
7
2 725 
3
2 574 
2025 Q1
8
3 387 
1
2 225 
2024 Q4
16
3 150 
1
537 
2024 Q3
9
3 372 
2
1 644 
2024 Q2
8
4 068 
3
2 217 
2024 Q1
11
4 269 
1
2 836 
2023 Q4
12
3 346 
2
3 043 
2023 Q3
8
3 399 
1
2 520 
2023 Q2
16
2 690 
0
--- 
2023 Q1
11
3 858 
1
2 132 
2022 Q4
12
2 840 
2
3 116 
2022 Q3
15
3 274 
4
2 681 
2022 Q2
8
3 069 
0
--- 
2022 Q1
7
3 206 
3
2 145 
2021 Q4
25
2 996 
0
--- 
2021 Q3
17
2 901 
0
--- 
2021 Q2
16
2 690 
1
1 038 
2021 Q1
6
2 520 
0
--- 
2020 Q4
16
2 796 
2
2 607 
2020 Q3
16
2 898 
2
1 468 
2020 Q2
9
2 747 
1
1 865 
2020 Q1
6
2 136 
1
2 923 
2019 Q4
9
2 438 
1
962 
2019 Q3
10
2 276 
3
1 887 
2019 Q2
11
2 496 
2
1 644 
2019 Q1
12
2 196 
2
1 866 
2018 Q4
12
2 680 
3
1 916 
2018 Q3
12
2 112 
1
1 000 
2018 Q2
11
2 560 
1
1 710 
2018 Q1
16
2 405 
0
--- 
2017 Q4
14
2 232 
5
2 571 
2017 Q3
20
2 334 
2
2 531 
2017 Q2
13
2 254 
3
1 512 
2017 Q1
9
2 026 
2
2 944 
2016 Q4
14
2 550 
0
--- 
2016 Q3
8
2 498 
1
1 232 
2016 Q2
8
2 580 
1
1 766 
2016 Q1
11
2 048 
0
--- 
2015 Q4
6
2 400 
0
--- 
2015 Q3
11
2 167 
2
2 040 
2015 Q2
4
2 089 
4
1 654 
2015 Q1
6
2 272 
2
1 953 
2014 Q4
11
2 890 
1
1 609 
2014 Q3
4
2 598 
0
--- 
2014 Q2
10
2 268 
1
3 356 
2014 Q1
6
2 112 
2
1 212 

Overview of the latest real estate transactions

The following list is an anonymized overview of the latest transactions. For more details and to find all transactions, please use the map to view transactions by plot or the transaction search page for a search by criteria.

2025-06-23
245 000 
3 769  /m²(65 m²)
Sale
Houses
House
2 rooms
65 m2
Land
47 m2
-Sols
2025-06-20
65 000 
Sale
Land
1335 m2
-Vignes
Land
761 m2
-Terres
Land
560 m2
-Landes
Land
991 m2
-Prés
Land
906 m2
-Prés
Land
619 m2
-Prés
Land
2972 m2
-Terres
/Légumière de plein champ
Land
922 m2
-Terres
Land
712 m2
-Terres
2025-06-19
201 385 
Sale
Land
1034 m2
-Vergers
/Oliveraie ou oliviers
2025-06-04
120 000 
2 400  /m²(50 m²)
Sale
Apartments
Apartment
2 rooms
50 m2
2025-05-27
257 400 
2 574  /m²(100 m²)
Sale
Apartments
Apartment
4 rooms
100 m2
Land
27 m2
-Sols
2025-05-26
470 000 
Sale
Land
676 m2
-Sols
2025-05-23
110 000 
Sale
Land
686 m2
-Terrains à bâtir
2025-05-23
190 000 
2 714  /m²(70 m²)
Sale
Houses
House
3 rooms
70 m2
Land
701 m2
-Sols
2025-05-22
440 000 
3 284  /m²(134 m²)
Sale
Apartments
Apartment
2 rooms
44 m2
Apartments
Apartment
6 rooms
90 m2
2 outbuildings
Land
895 m2
-Sols
2025-05-19
357 000 
2 725  /m²(131 m²)
Sale
Houses
House
5 rooms
131 m2
Land
342 m2
-Sols
2025-05-12
1 000 
Sale
Land
1150 m2
-Sols
2025-04-30
220 000 
2 095  /m²(105 m²)
Sale
Commercial property
105 m2
2025-04-30
470 000 
7 833  /m²(60 m²)
Sale
Houses
House
2 rooms
60 m2
Land
133 m2
-Sols
2025-04-30
247 000 
2 041  /m²(121 m²)
Sale
Houses
House
6 rooms
121 m2
2 outbuildings
Land
500 m2
-Sols
Land
1289 m2
-Terres
Land
25 m2
-Terres
Land
60 m2
-Terres
2025-04-28
155 000 
Sale
Land
733 m2
-Terres
2025-04-28
249 710 
3 842  /m²(65 m²)
Sale
Houses
House
3 rooms
65 m2
Land
911 m2
-Sols
Land
158 m2
-Terres
2025-04-28
230 000 
2 447  /m²(94 m²)
Sale
Houses
House
4 rooms
94 m2
Land
427 m2
-Sols
2025-04-25
30 000 
Sale
Land
2059 m2
-Jardins
/Jardin potager
Land
5169 m2
-Terres
2025-04-11
107 000 
Sale
Land
665 m2
-Terres
2025-04-07
900 
Exchange
Land
90 m2
-Jardins
/Jardin potager
Land
14 m2
-Vignes
Land
76 m2
-Terres
/Légumière de plein champ
987 transactions listed in the municipality

Gard (30)

Most expensive cities

City
name
Descending orderHouses
house
Price per m²
4 483 
4 034 
3 942 
3 835 
3 606 
3 505 
City
name
Descending orderApartments
apt.
Price per m²
5 174 
5 102 
3 626 
3 553 
3 286 
3 112 
2 994 
2 960 

Least expensive cities

City
name
Ascending orderHouses
house
Price per m²
838 
846 
988 
1 057 
1 135 
1 140 
1 216 
1 226 
City
name
Ascending orderApartments
apt.
Price per m²
188 
208 
300 
340 
438 
558 
600