emooki
HomePrice mapTransactions
🇬🇧 English🇫🇷 Français🇩🇪 Deutsch🇪🇸 Español🇮🇹 Italiano

Real estate price map


Real estate price map in the Corse-du-Sud department.

Department 2A
Corse-du-Sud

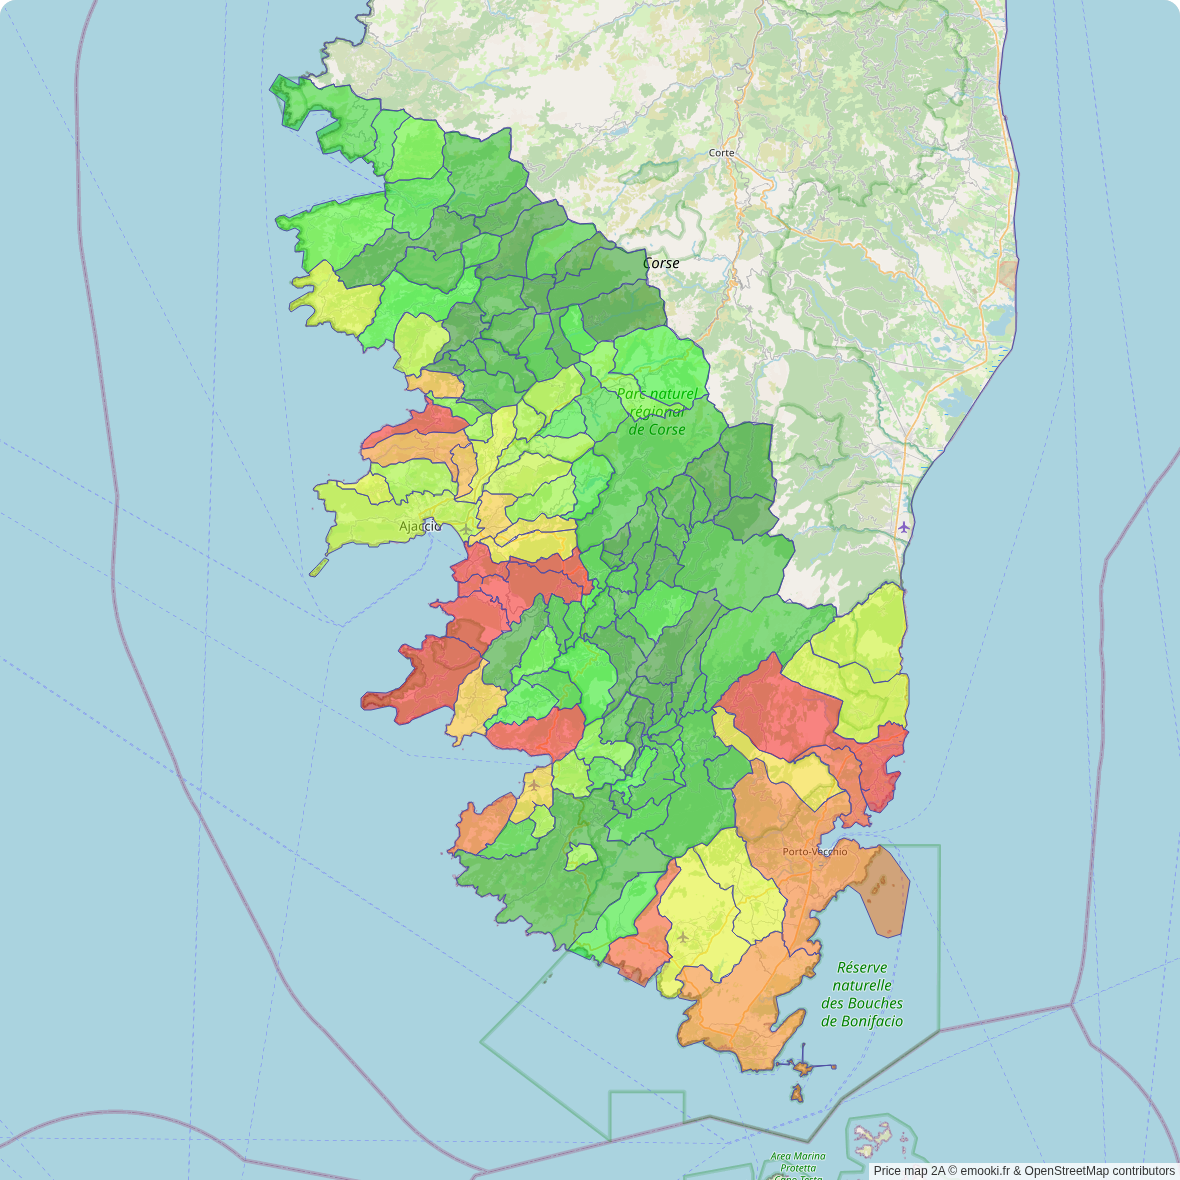
Median price of real estate
in the Corse-du-Sud department

HousesHouses
4 914 € /m²
1-23-45-67-89-10
Reliability 10/10
Median price on the 147 transactions of the last 3 months.
from 2 659 to
7 776 € /m²
60% of transactions from the 2nd to the 8th deciles.
ApartmentsApartments
3 717 € /m²
1-23-45-67-89-10
Reliability 10/10
Median price on the 315 transactions of the last 3 months.
from 2 358 to
5 568 € /m²
60% of transactions from the 2nd to the 8th deciles.
DwellingsDwellings
4 075 € /m²
1-23-45-67-89-10
Reliability 10/10
Median price on the 462 transactions of the last 3 months.
from 2 450 to
6 022 € /m²
60% of transactions from the 2nd to the 8th deciles.
HousesEvolution of the price per m² of houses since...
1 year
+5.6%
2 years
+3%
3 years
-0.7%
4 years
+7.1%
5 years
+31%
6 years
+30%
7 years
+32%
8 years
+41%
9 years
+49%
10 years
+52%
11 years
+55%
ApartmentsEvolution of the price per m² of apartments since...
1 year
+0.8%
2 years
+1.8%
3 years
+5.8%
4 years
+11%
5 years
+19%
6 years
+23%
7 years
+28%
8 years
+28%
9 years
+32%
10 years
+34%
11 years
+33%

Yearly evolution

Evolution of the median price per m²

Evolution of the number of transactions

Warning, last year incomplete. Projections made based on the proportions between semesters of the previous year at the departmental/national level and by type of property.

Yearly data

Descending order
Year
Houses
house
transactions
Houses
house
Price per m²
Apartments
apt.
transactions
Apartments
apt.
Price per m²
2025
310
4 746 €
627
3 846 €
2024
667
4 496 €
1 126
3 814 €
2023
698
4 610 €
1 267
3 778 €
2022
934
4 780 €
1 603
3 635 €
2021
894
4 432 €
1 624
3 479 €
2020
723
3 611 €
1 268
3 224 €
2019
748
3 654 €
1 435
3 125 €
2018
721
3 600 €
1 346
2 994 €
2017
734
3 374 €
1 326
3 000 €
2016
552
3 191 €
1 092
2 909 €
2015
497
3 125 €
967
2 870 €
2014
475
3 071 €
865
2 900 €

Analysis

Structure of prices per m²

Values of price percentiles per m² over the periods used for the estimated price of each type of property.

Structure of transaction amounts

Values of transaction amounts percentiles over the periods used for the estimated price of each type of property.

Transaction amounts and prices per m² by percentile

Ascending order
Percentile
Houses
house
Price per m²
Houses
house
Transaction amount
Apartments
apt.
Price per m²
Apartments
apt.
Transaction amount
10th percentile
1 620 €
128 K€
1 440 €
80 807 €
20th percentile
2 659 €
214 K€
2 358 €
126 K€
30th percentile
3 838 €
310 K€
2 808 €
153 K€
40th percentile
4 369 €
441 K€
3 258 €
178 K€
50th percentile
4 914 €
510 K€
3 717 €
204 K€
60th percentile
5 485 €
594 K€
4 171 €
235 K€
70th percentile
6 388 €
709 K€
4 887 €
271 K€
80th percentile
7 776 €
966 K€
5 568 €
324 K€
90th percentile
10 106 €
1 442 K€
6 298 €
450 K€

Quarterly evolution

Evolution of the median price per m²

Evolution of the number of transactions

Quarterly data

Descending order
Quarter
Houses
house
transactions
Houses
house
Price per m²
Apartments
apt.
transactions
Apartments
apt.
Price per m²
2025 Q2
147
4 914 €
315
3 717 €
2025 Q1
163
4 408 €
312
3 961 €
2024 Q4
201
4 683 €
306
3 871 €
2024 Q3
159
4 348 €
275
3 515 €
2024 Q2
157
4 091 €
274
3 822 €
2024 Q1
150
4 585 €
271
3 830 €
2023 Q4
195
4 943 €
294
3 821 €
2023 Q3
173
3 892 €
279
3 804 €
2023 Q2
172
4 547 €
326
3 888 €
2023 Q1
158
4 888 €
368
3 611 €
2022 Q4
248
5 149 €
417
3 793 €
2022 Q3
205
5 114 €
355
3 693 €
2022 Q2
244
4 317 €
449
3 638 €
2022 Q1
237
4 703 €
382
3 429 €
2021 Q4
243
4 858 €
423
3 571 €
2021 Q3
207
4 410 €
411
3 491 €
2021 Q2
220
4 050 €
446
3 408 €
2021 Q1
224
4 356 €
344
3 512 €
2020 Q4
214
3 762 €
358
3 273 €
2020 Q3
180
3 299 €
296
2 979 €
2020 Q2
165
3 734 €
274
3 312 €
2020 Q1
164
3 660 €
340
3 278 €
2019 Q4
211
4 032 €
381
3 216 €
2019 Q3
190
3 624 €
368
3 025 €
2019 Q2
188
3 558 €
379
3 125 €
2019 Q1
159
3 571 €
307
3 155 €
2018 Q4
211
3 722 €
352
3 094 €
2018 Q3
158
3 448 €
307
2 955 €
2018 Q2
192
3 628 €
354
2 880 €
2018 Q1
160
3 545 €
333
3 032 €
2017 Q4
211
3 361 €
338
3 000 €
2017 Q3
171
3 400 €
340
2 916 €
2017 Q2
191
3 245 €
331
3 041 €
2017 Q1
161
3 654 €
317
3 011 €
2016 Q4
156
3 341 €
298
3 046 €
2016 Q3
141
3 106 €
309
2 833 €
2016 Q2
137
3 282 €
270
2 866 €
2016 Q1
118
3 042 €
215
3 140 €
2015 Q4
151
3 077 €
266
2 862 €
2015 Q3
124
3 188 €
270
2 745 €
2015 Q2
114
2 991 €
210
2 876 €
2015 Q1
108
3 308 €
221
3 000 €
2014 Q4
142
3 098 €
217
2 963 €
2014 Q3
120
2 954 €
222
2 952 €
2014 Q2
83
3 243 €
216
2 680 €
2014 Q1
130
3 044 €
210
2 999 €

Corse-du-Sud (2A)

Most expensive cities

City
name
Descending orderHouses
house
Price per m²
8 029 €
6 438 €
6 402 €
6 401 €
6 245 €
6 215 €
6 104 €
6 016 €
5 778 €
5 526 €
City
name
Descending orderApartments
apt.
Price per m²
6 589 €
6 176 €
5 850 €
5 588 €
5 254 €
5 135 €
5 049 €
4 850 €
4 625 €
4 598 €

Least expensive cities

City
name
Ascending orderHouses
house
Price per m²
256 €
296 €
366 €
556 €
607 €
714 €
765 €
836 €
917 €
921 €
City
name
Ascending orderApartments
apt.
Price per m²
75 €
113 €
154 €
319 €
332 €
352 €
424 €
450 €
457 €
460 €