emooki
HomePrice mapTransactions
🇬🇧 English🇫🇷 Français🇩🇪 Deutsch🇪🇸 Español🇮🇹 Italiano

Real estate price map


Real estate price map in the municipality of Casaglione.

Corse-du-Sud (2A)
Casaglione

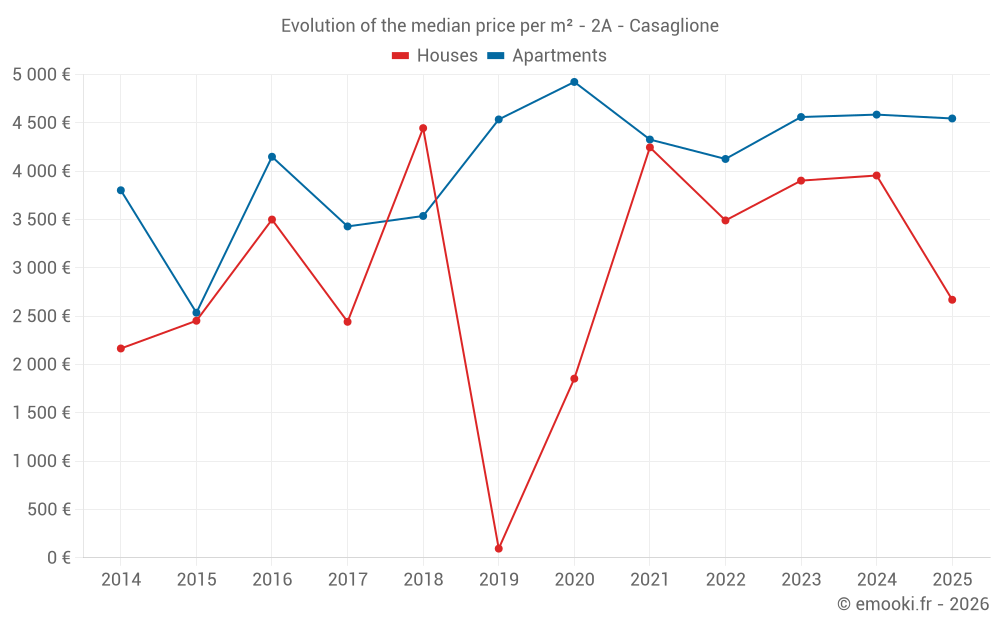
Median price of real estate
in the municipality of Casaglione

HousesHouses
3 846 € /m²
1-23-45-67-89-10
Reliability 6/10
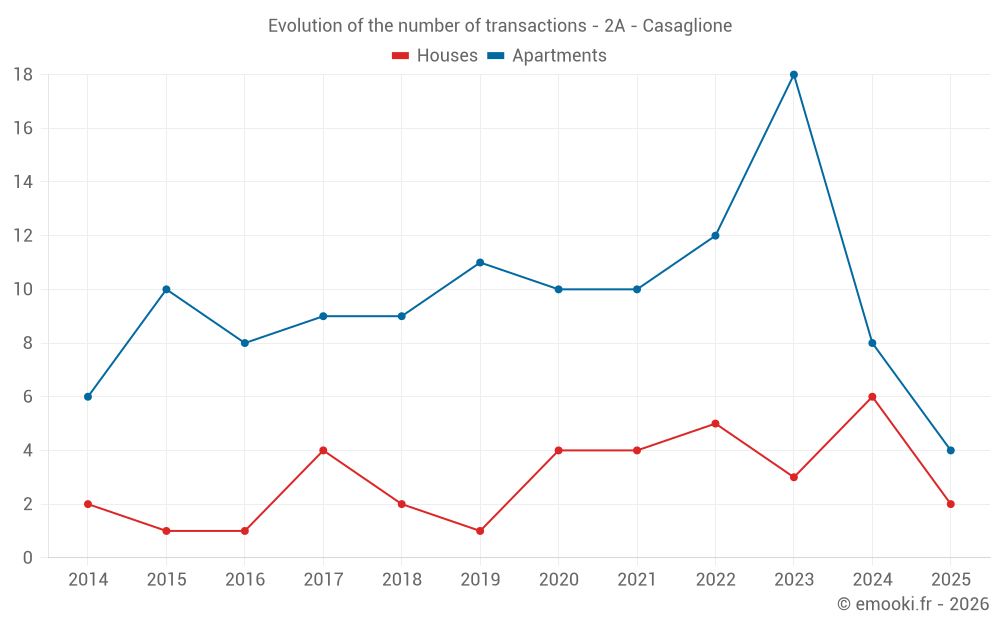
Median price on the 12 transactions of the last 36 months.
from 3 249 to
5 672 € /m²
60% of transactions from the 2nd to the 8th deciles.
ApartmentsApartments
4 455 € /m²
1-23-45-67-89-10
Reliability 7/10
Median price on the 21 transactions of the last 24 months.
from 3 516 to
5 000 € /m²
60% of transactions from the 2nd to the 8th deciles.
DwellingsDwellings
4 630 € /m²
1-23-45-67-89-10
Reliability 8/10
Median price on the 16 transactions of the last 12 months.
from 3 435 to
5 596 € /m²
60% of transactions from the 2nd to the 8th deciles.
HousesEvolution of the price per m² of houses
1 year
--
2 years
--
3 years
--
4 years
--
5 years
--
6 years
--
7 years
--
8 years
--
9 years
--
10 years
--
11 years
--
ApartmentsEvolution of the price per m² of apartments
1 year
--
2 years
--
3 years
--
4 years
--
5 years
--
6 years
--
7 years
--
8 years
--
9 years
--
10 years
--
11 years
--

Yearly evolution

Median price per m²

Number of transactions

Warning, last year incomplete. Projections made based on the proportions between semesters of the previous year at the departmental/national level and by type of property.

Yearly data

Descending order
Year
Houses
house
Price per m²
Houses
house
transactions
Apartments
apt.
Price per m²
Apartments
apt.
transactions
2025
2 670 €
2
4 546 €
4
2024
3 956 €
6
4 586 €
8
2023
3 903 €
3
4 561 €
18
2022
3 491 €
5
4 127 €
12
2021
4 247 €
4
4 328 €
10
2020
1 854 €
4
4 924 €
10
2019
95 €
1
4 536 €
11
2018
4 446 €
2
3 537 €
9
2017
2 442 €
4
3 429 €
9
2016
3 500 €
1
4 150 €
8
2015
2 453 €
1
2 536 €
10
2014
2 166 €
2
3 803 €
6

Analysis

Structure of prices per m²

Values of price percentiles per m² over the periods used for the estimated price of each type of property.

Structure of transaction amounts

Values of transaction amounts percentiles over the periods used for the estimated price of each type of property.

Transaction amounts and prices per m² by percentile

Ascending order
Percentile
Houses
house
Price per m²
Houses
house
Transaction amount
Apartments
apt.
Price per m²
Apartments
apt.
Transaction amount
10th percentile
2 611 €
226 500 €
2 907 €
107 820 €
20th percentile
3 249 €
248 000 €
3 516 €
124 550 €
30th percentile
3 517 €
292 000 €
3 774 €
129 000 €
40th percentile
3 748 €
356 060 €
4 171 €
140 000 €
50th percentile
3 846 €
455 075 €
4 455 €
164 865 €
60th percentile
4 251 €
582 019 €
4 730 €
170 000 €
70th percentile
4 939 €
646 010 €
4 970 €
188 859 €
80th percentile
5 672 €
658 000 €
5 000 €
218 000 €
90th percentile
6 292 €
705 360 €
5 386 €
292 000 €

Quarterly evolution

Median price per m²

Number of transactions

Quarterly data

Descending order
Quarter
Houses
house
Price per m²
Houses
house
transactions
Apartments
apt.
Price per m²
Apartments
apt.
transactions
2025 Q2
2 670 €
2
4 313 €
1
2025 Q1
--- €
0
4 778 €
3
2024 Q4
5 144 €
4
5 193 €
6
2024 Q2
--- €
0
4 059 €
1
2024 Q1
2 987 €
2
2 799 €
1
2023 Q4
3 903 €
1
3 774 €
5
2023 Q3
3 721 €
1
4 561 €
4
2023 Q2
6 346 €
1
5 804 €
3
2023 Q1
--- €
0
4 688 €
6
2022 Q4
5 135 €
1
4 964 €
5
2022 Q3
--- €
0
2 722 €
3
2022 Q2
3 266 €
2
4 286 €
3
2022 Q1
3 034 €
2
2 857 €
1
2021 Q4
3 115 €
1
5 227 €
1
2021 Q3
--- €
0
4 346 €
5
2021 Q2
4 818 €
2
4 090 €
3
2021 Q1
5 379 €
1
3 632 €
1
2020 Q4
380 €
2
5 900 €
1
2020 Q3
3 209 €
1
4 924 €
4
2020 Q2
--- €
0
5 507 €
1
2020 Q1
5 290 €
1
4 416 €
4
2019 Q4
--- €
0
5 278 €
5
2019 Q3
95 €
1
3 684 €
1
2019 Q2
--- €
0
4 697 €
3
2019 Q1
--- €
0
2 950 €
2
2018 Q4
4 471 €
1
4 667 €
3
2018 Q3
--- €
0
1 704 €
2
2018 Q2
--- €
0
3 438 €
3
2018 Q1
4 422 €
1
3 537 €
1
2017 Q4
2 400 €
3
3 429 €
3
2017 Q3
--- €
0
1 310 €
2
2017 Q2
2 484 €
1
4 302 €
2
2017 Q1
--- €
0
4 268 €
2
2016 Q4
--- €
0
3 485 €
1
2016 Q3
3 500 €
1
4 575 €
3
2016 Q2
--- €
0
4 222 €
2
2016 Q1
--- €
0
3 292 €
2
2015 Q4
2 453 €
1
1 608 €
4
2015 Q3
--- €
0
4 240 €
1
2015 Q2
--- €
0
2 424 €
3
2015 Q1
--- €
0
2 536 €
2
2014 Q4
2 166 €
2
2 568 €
2
2014 Q3
--- €
0
3 667 €
3
2014 Q1
--- €
0
4 783 €
1

Corse-du-Sud (2A)

Most expensive cities

City
name
Descending orderHouses
house
Price per m²
8 029 €
6 438 €
6 402 €
6 401 €
6 245 €
6 215 €
6 104 €
6 016 €
5 778 €
5 526 €
City
name
Descending orderApartments
apt.
Price per m²
6 589 €
6 176 €
5 850 €
5 588 €
5 254 €
5 135 €
5 049 €
4 850 €
4 625 €
4 598 €

Least expensive cities

City
name
Ascending orderHouses
house
Price per m²
256 €
296 €
366 €
556 €
607 €
714 €
765 €
836 €
917 €
921 €
City
name
Ascending orderApartments
apt.
Price per m²
75 €
113 €
154 €
319 €
332 €
352 €
424 €
450 €
457 €
460 €