emooki
HomePrice mapTransactions
🇬🇧 English🇫🇷 Français🇩🇪 Deutsch🇪🇸 Español🇮🇹 Italiano

Real estate price map


Real estate price map in the municipality of Lecci, choose a section to see transactions by parcel.

Corse-du-Sud (2A)

Lecci - Real estate price m²

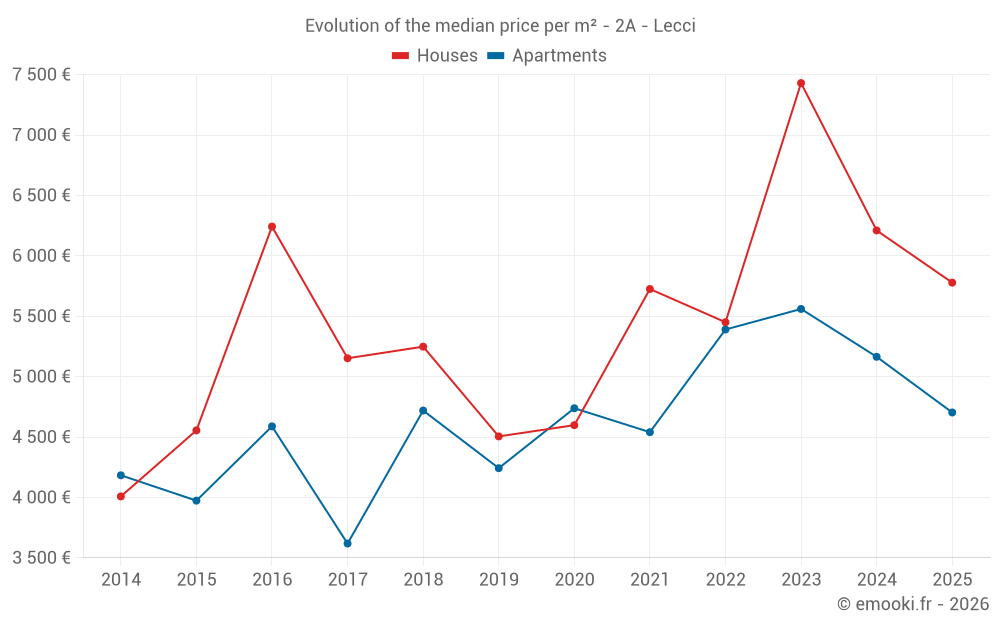
Median price of real estate
in the municipality of Lecci

HousesHouses
5 778  /m²
1-23-45-67-89-10
Reliability 9/10
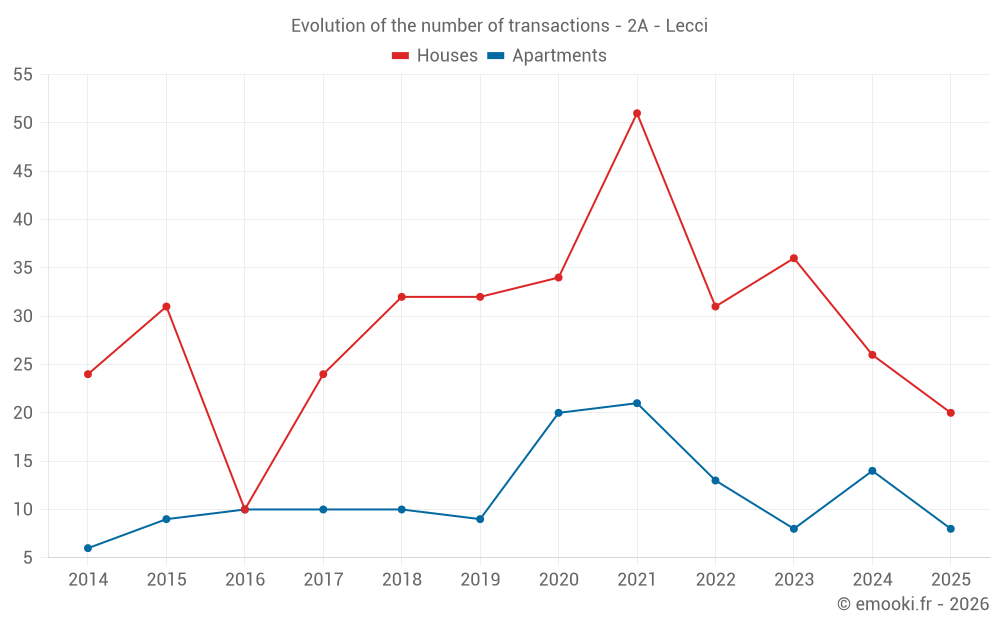
Median price on the 20 transactions of the last 6 months.
from 5 007 to
7 427  /m²
60% of transactions from the 2nd to the 8th deciles.
ApartmentsApartments
5 135  /m²
1-23-45-67-89-10
Reliability 7/10
Median price on the 28 transactions of the last 24 months.
from 3 522 to
6 197  /m²
60% of transactions from the 2nd to the 8th deciles.
DwellingsDwellings
5 436  /m²
1-23-45-67-89-10
Reliability 9/10
Median price on the 28 transactions of the last 6 months.
from 4 750 to
6 999  /m²
60% of transactions from the 2nd to the 8th deciles.
HousesEvolution of the price per m² of houses since...
1 year
-7%
2 years
-22%
3 years
+6%
4 years
+0.9%
5 years
+26%
6 years
+28%
7 years
+10%
8 years
+12%
9 years
-7.4%
10 years
+27%
11 years
+44%
The price per m² of houses has decreased by 22% since 2 years, but it has increased by 44% in 11 years.
ApartmentsEvolution of the price per m² of apartments since...
1 year
-8.9%
2 years
-15%
3 years
-13%
4 years
+3.6%
5 years
-0.7%
6 years
+11%
7 years
-0.3%
8 years
+30%
9 years
+2.5%
10 years
+18%
11 years
+12%
The price per m² of apartments has decreased by 15% since 2 years, but it has increased by 30% in 8 years.

Yearly evolution

Evolution of the median price per m²

Evolution of the median price per m² - 2A - Lecci

Evolution of the number of transactions

Warning, last year incomplete. Projections made based on the proportions between semesters of the previous year at the departmental/national level and by type of property.

Evolution of the number of transactions - 2A - Lecci

Yearly data

Descending order
Year
Houses
house
transactions
Houses
house
Price per m²
Apartments
apt.
transactions
Apartments
apt.
Price per m²
2025
20
5 778 
8
4 703 
2024
26
6 210 
14
5 164 
2023
36
7 430 
8
5 560 
2022
31
5 450 
13
5 390 
2021
51
5 725 
21
4 540 
2020
34
4 598 
20
4 738 
2019
32
4 505 
9
4 242 
2018
32
5 248 
10
4 719 
2017
24
5 152 
10
3 618 
2016
10
6 242 
10
4 588 
2015
31
4 555 
9
3 973 
2014
24
4 008 
6
4 183 

Analysis

Structure of prices per m²

Values of price percentiles per m² over the periods used for the estimated price of each type of property.

Structure of transaction amounts

Values of transaction amounts percentiles over the periods used for the estimated price of each type of property.

Transaction amounts and prices per m² by percentile

Ascending order
Percentile
Houses
house
Price per m²
Houses
house
Transaction amount
Apartments
apt.
Price per m²
Apartments
apt.
Transaction amount
10th percentile
4 834 
499 K
2 881 
177 K
20th percentile
5 007 
535 K
3 522 
225 K
30th percentile
5 307 
547 K
4 269 
240 K
40th percentile
5 445 
663 K
4 531 
262 K
50th percentile
5 778 
756 K
5 135 
281 K
60th percentile
6 332 
788 K
5 223 
298 K
70th percentile
6 804 
906 K
5 550 
317 K
80th percentile
7 427 
984 K
6 197 
384 K
90th percentile
7 918 
1 058 K
6 562 
435 K

National and departmental comparison

Evolution of the median price per m² of houses

Evolution of the median price per m² of apartments

Quarterly evolution

Evolution of the median price per m²

Evolution of the number of transactions

Quarterly data

Descending order
Quarter
Houses
house
transactions
Houses
house
Price per m²
Apartments
apt.
transactions
Apartments
apt.
Price per m²
2025 Q2
12
5 400 
3
2 903 
2025 Q1
8
6 782 
5
4 932 
2024 Q4
10
5 310 
5
5 156 
2024 Q3
8
6 431 
2
4 931 
2024 Q2
5
7 182 
2
4 526 
2024 Q1
3
4 768 
5
5 173 
2023 Q4
15
9 646 
4
4 814 
2023 Q3
5
5 750 
2
5 136 
2023 Q2
10
11 036 
2
6 118 
2023 Q1
6
3 966 
0
--- 
2022 Q4
10
5 574 
1
5 438 
2022 Q3
5
5 208 
2
4 705 
2022 Q2
10
5 728 
7
6 061 
2022 Q1
6
6 105 
3
4 742 
2021 Q4
14
5 501 
8
4 368 
2021 Q3
7
6 851 
5
4 884 
2021 Q2
14
6 716 
5
2 889 
2021 Q1
16
5 714 
3
4 838 
2020 Q4
12
4 358 
9
4 601 
2020 Q3
4
4 502 
2
8 105 
2020 Q2
10
4 808 
4
5 294 
2020 Q1
8
4 924 
5
4 758 
2019 Q4
7
4 439 
3
3 700 
2019 Q3
6
4 609 
2
3 843 
2019 Q2
9
4 345 
3
4 266 
2019 Q1
10
4 763 
1
4 212 
2018 Q4
10
4 806 
4
4 600 
2018 Q3
7
5 639 
2
4 893 
2018 Q2
10
6 315 
1
4 882 
2018 Q1
5
3 942 
3
4 589 
2017 Q4
6
5 492 
4
1 667 
2017 Q3
4
4 911 
2
4 903 
2017 Q2
4
11 430 
0
--- 
2017 Q1
10
5 294 
4
4 542 
2016 Q4
5
4 461 
4
4 420 
2016 Q3
3
8 600 
2
4 874 
2016 Q2
1
7 403 
1
4 344 
2016 Q1
1
13 656 
3
4 590 
2015 Q4
9
4 725 
1
3 973 
2015 Q3
7
7 733 
2
5 248 
2015 Q2
9
3 857 
2
3 276 
2015 Q1
6
5 596 
4
3 932 
2014 Q4
6
10 397 
2
4 755 
2014 Q3
8
4 309 
1
4 419 
2014 Q2
3
3 899 
0
--- 
2014 Q1
7
2 875 
3
3 488 

Overview of the latest real estate transactions

The following list is an anonymized overview of the latest transactions. For more details and to find all transactions, please use the map to view transactions by plot or the transaction search page for a search by criteria.

2025-06-18
62 000 
Sale
Land
541 m2
-Terrains à bâtir
2025-06-16
1 056 036 
5 280  /m²(200 m²)
Sale
Houses
House
7 rooms
200 m2
1 outbuilding
Land
779 m2
-Terrains d'agrément
Land
314 m2
-Terres
2025-06-11
970 155 
4 851  /m²(200 m²)
Sale
Houses
House
8 rooms
200 m2
1 outbuilding
Land
1363 m2
-Bois
/Maquis
Land
2250 m2
-Terres
2025-06-05
89 000 
Sale
Land
35 m2
-Terres
Land
731 m2
-Terrains à bâtir
2025-06-04
169 850 
2 831  /m²(60 m²)
Sale
Apartments
Apartment
1 room
60 m2
2025-05-27
540 000 
7 826  /m²(69 m²)
Sale
Houses
House
3 rooms
69 m2
2025-05-23
625 000 
9 470  /m²(66 m²)
Sale
Houses
House
4 rooms
66 m2
1 outbuilding
2025-05-22
1 500 000 
Sale
Land
174 m2
-Terres
Land
892 m2
-Terres
Land
891 m2
-Terres
Land
894 m2
-Terres
Land
873 m2
-Terres
Land
869 m2
-Terres
Land
871 m2
-Terres
Land
780 m2
-Terres
Land
760 m2
-Terres
Land
762 m2
-Terres
Land
754 m2
-Terres
Land
1253 m2
-Terres
2025-05-19
130 000 
Sale
Land
726 m2
-Sols
2025-05-16
756 800 
4 914  /m²(154 m²)
Sale
Houses
House
3 rooms
154 m2
1 outbuilding
Land
750 m2
-Sols
2025-05-13
493 230 
5 480  /m²(90 m²)
Sale
Houses
House
3 rooms
90 m2
1 outbuilding
Land
69 m2
-Sols
Land
74 m2
-Bois
/Maquis
Land
21 m2
-Terrains d'agrément
/Terrain de sport
Land
248 m2
-Bois
/Chênes-lièges
2025-05-02
950 000 
Sale
Land
880 m2
-Bois
/Chênes-lièges
2025-04-24
110 000 
Sale
Land
100 m2
-Sols
2025-04-24
306 235 
6 005  /m²(51 m²)
Sale
Apartments
Apartment
3 rooms
51 m2
1 outbuilding
2025-04-23
830 000 
5 030  /m²(165 m²)
Sale
Houses
House
7 rooms
165 m2
1 outbuilding
Land
1020 m2
-Sols
2025-04-17
950 000 
6 376  /m²(149 m²)
Sale
Houses
House
4 rooms
109 m2
Land
613 m2
-Sols
Houses
House
1 room
40 m2
Land
596 m2
-Sols
2025-04-15
3 382 686 
6 530  /m²(518 m²)
Sale
Commercial property
518 m2
Land
162 m2
-Terrains d'agrément
/Dépendances d'ensemble immobilier
Land
482 m2
-Sols
2025-04-10
515 000 
4 682  /m²(110 m²)
Sale
Houses
House
4 rooms
110 m2
1 outbuilding
Land
857 m2
-Sols
2025-04-10
313 150 
3 599  /m²(87 m²)
Sale
Commercial property
87 m2
2025-04-07
688 500 
5 643  /m²(122 m²)
Sale
Houses
House
4 rooms
122 m2
Land
1287 m2
-Sols
1117 transactions listed in the municipality

Corse-du-Sud (2A)

Most expensive cities

City
name
Descending orderHouses
house
Price per m²
8 029 
6 438 
6 402 
6 401 
6 245 
6 215 
6 016 
5 778 
5 526 
City
name
Descending orderApartments
apt.
Price per m²
6 589 
6 176 
5 850 
5 588 
5 254 
5 135 
5 049 
4 850 
4 625 
4 598 

Least expensive cities

City
name
Ascending orderHouses
house
Price per m²
256 
296 
366 
556 
607 
714 
765 
917 
921 
City
name
Ascending orderApartments
apt.
Price per m²
75 
113 
319 
332 
352 
424 
450 
457 
460