Median price of real estate
in the municipality of Albitreccia
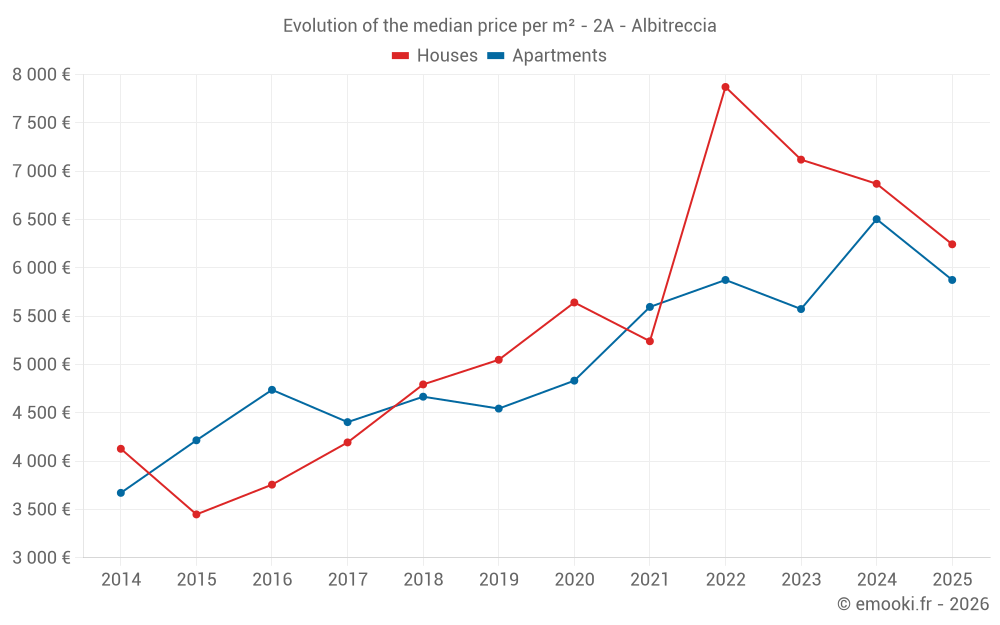
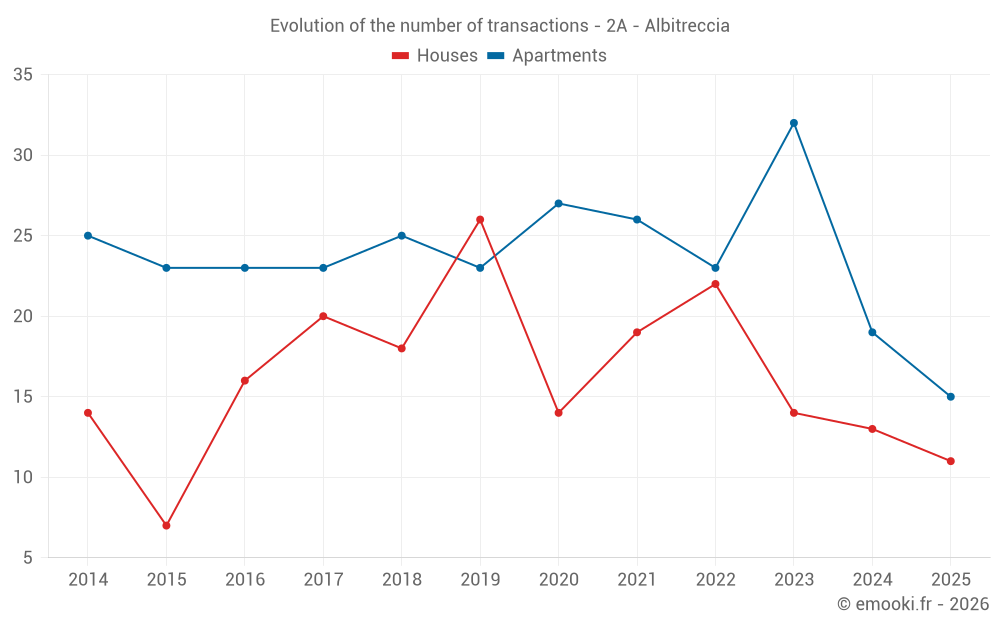
Houses
5 526 € /m²
Reliability 8/10
Median price on the 16 transactions of the last 12 months.
from 4 395 to
7 993 € /m²
7 993 € /m²
60% of transactions from the 2nd to the 8th deciles.
Apartments
5 850 € /m²
Reliability 8/10
Median price on the 26 transactions of the last 12 months.
from 5 300 to
6 827 € /m²
6 827 € /m²
60% of transactions from the 2nd to the 8th deciles.
Dwellings
5 962 € /m²
Reliability 9/10
Median price on the 26 transactions of the last 6 months.
from 5 192 to
6 911 € /m²
6 911 € /m²
60% of transactions from the 2nd to the 8th deciles.