emooki
HomePrice mapTransactions
🇬🇧 English🇫🇷 Français🇩🇪 Deutsch🇪🇸 Español🇮🇹 Italiano

Real estate price map


Real estate price map in the municipality of Eccica-Suarella.

Corse-du-Sud (2A)
Eccica-Suarella

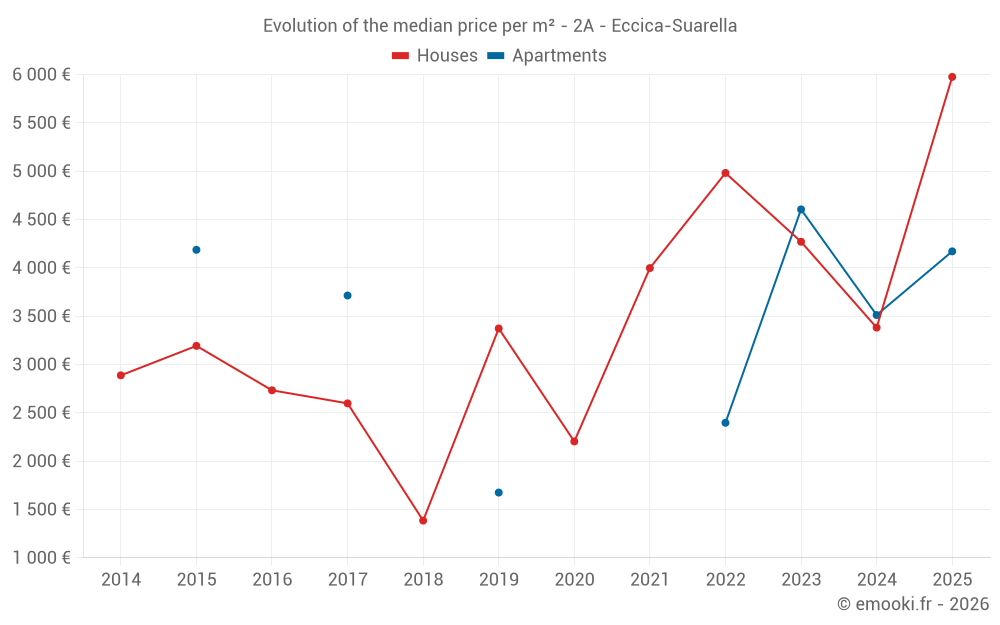
Median price of real estate
in the municipality of Eccica-Suarella

HousesHouses
4 450 € /m²
1-23-45-67-89-10
Reliability 6/10
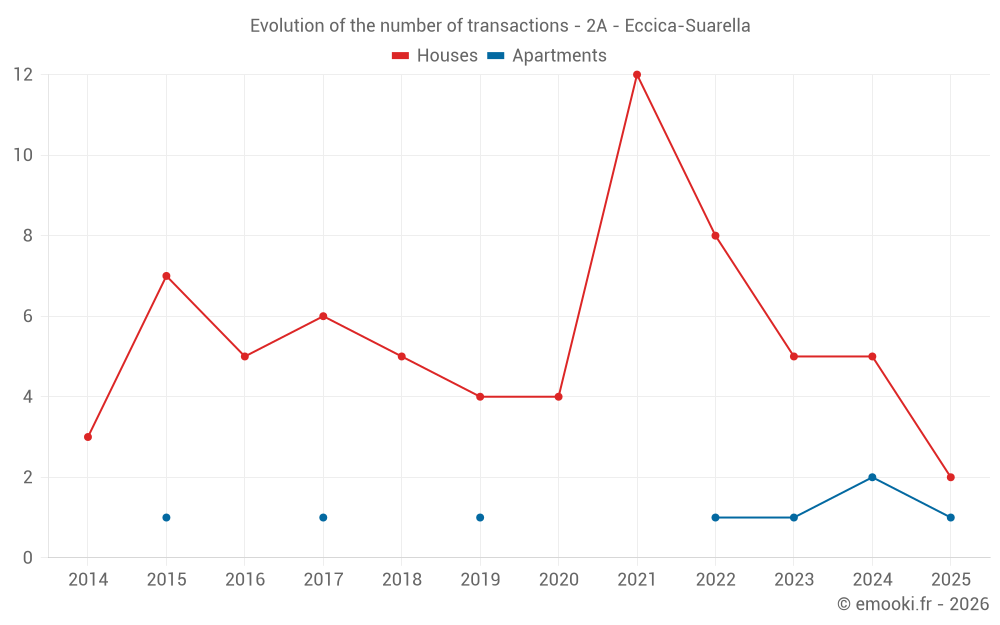
Median price on the 16 transactions of the last 36 months.
from 2 286 to
5 917 € /m²
60% of transactions from the 2nd to the 8th deciles.
ApartmentsApartments
3 296 € /m²
1-23-45-67-89-10
Reliability 3/10
Median price on the 6 transactions of the last 72 months.
DwellingsDwellings
4 270 € /m²
1-23-45-67-89-10
Reliability 6/10
Median price on the 21 transactions of the last 36 months.
from 2 397 to
5 435 € /m²
60% of transactions from the 2nd to the 8th deciles.
HousesEvolution of the price per m² of houses
1 year
--
2 years
--
3 years
--
4 years
--
5 years
--
6 years
--
7 years
--
8 years
--
9 years
--
10 years
--
11 years
--
ApartmentsEvolution of the price per m² of apartments
1 year
--
2 years
--
3 years
--
4 years
--
5 years
--
6 years
--
7 years
--
8 years
--
9 years
--
10 years
--
11 years
--

Yearly evolution

Median price per m²

Number of transactions

Warning, last year incomplete. Projections made based on the proportions between semesters of the previous year at the departmental/national level and by type of property.

Yearly data

Descending order
Year
Houses
house
Price per m²
Houses
house
transactions
Apartments
apt.
Price per m²
Apartments
apt.
transactions
2025
5 976 €
2
4 171 €
1
2024
3 382 €
5
3 512 €
2
2023
4 270 €
5
4 605 €
1
2022
4 982 €
8
2 397 €
1
2021
3 998 €
12
--- €
0
2020
2 204 €
4
--- €
0
2019
3 373 €
4
1 675 €
1
2018
1 385 €
5
--- €
0
2017
2 598 €
6
3 714 €
1
2016
2 733 €
5
--- €
0
2015
3 193 €
7
4 187 €
1
2014
2 888 €
3
--- €
0

Analysis

Structure of prices per m²

Values of price percentiles per m² over the periods used for the estimated price of each type of property.

Structure of transaction amounts

Values of transaction amounts percentiles over the periods used for the estimated price of each type of property.

Transaction amounts and prices per m² by percentile

Ascending order
Percentile
Houses
house
Price per m²
Houses
house
Transaction amount
Apartments
apt.
Price per m²
Apartments
apt.
Transaction amount
10th percentile
1 158 €
189 150 €
2 036 €
166 000 €
20th percentile
2 286 €
225 000 €
2 397 €
211 000 €
30th percentile
3 523 €
250 000 €
2 408 €
251 500 €
40th percentile
4 127 €
282 950 €
2 420 €
292 000 €
50th percentile
4 450 €
457 000 €
3 296 €
319 800 €
60th percentile
4 878 €
487 000 €
4 171 €
347 600 €
70th percentile
5 190 €
510 000 €
4 388 €
348 800 €
80th percentile
5 917 €
541 500 €
4 605 €
350 000 €
90th percentile
6 581 €
593 600 €
4 605 €
350 000 €

Quarterly evolution

Median price per m²

Number of transactions

Quarterly data

Descending order
Quarter
Houses
house
Price per m²
Houses
house
transactions
Apartments
apt.
Price per m²
Apartments
apt.
transactions
2025 Q2
--- €
0
4 171 €
1
2025 Q1
5 976 €
2
--- €
0
2024 Q4
4 944 €
1
--- €
0
2024 Q3
4 127 €
1
--- €
0
2024 Q2
3 382 €
1
4 605 €
1
2024 Q1
1 805 €
2
2 420 €
1
2023 Q4
4 270 €
1
4 605 €
1
2023 Q2
635 €
2
--- €
0
2023 Q1
6 596 €
2
--- €
0
2022 Q4
3 664 €
1
--- €
0
2022 Q3
5 435 €
3
2 397 €
1
2022 Q2
5 680 €
2
--- €
0
2022 Q1
2 626 €
2
--- €
0
2021 Q4
5 468 €
2
--- €
0
2021 Q3
3 440 €
4
--- €
0
2021 Q2
4 232 €
3
--- €
0
2021 Q1
2 105 €
3
--- €
0
2020 Q4
2 784 €
1
--- €
0
2020 Q3
2 108 €
2
--- €
0
2020 Q1
1 682 €
1
--- €
0
2019 Q4
4 194 €
2
1 675 €
1
2019 Q2
4 400 €
1
--- €
0
2019 Q1
2 346 €
1
--- €
0
2018 Q2
1 266 €
4
--- €
0
2018 Q1
2 336 €
1
--- €
0
2017 Q3
2 681 €
4
--- €
0
2017 Q2
1 974 €
1
--- €
0
2017 Q1
3 215 €
1
3 714 €
1
2016 Q4
2 733 €
3
--- €
0
2016 Q3
1 884 €
1
--- €
0
2016 Q1
2 907 €
1
--- €
0
2015 Q4
2 470 €
1
--- €
0
2015 Q3
3 240 €
2
--- €
0
2015 Q2
2 750 €
3
--- €
0
2015 Q1
5 079 €
1
4 187 €
1
2014 Q4
2 333 €
1
--- €
0
2014 Q3
5 435 €
1
--- €
0
2014 Q2
2 888 €
1
--- €
0

Corse-du-Sud (2A)

Most expensive cities

City
name
Descending orderHouses
house
Price per m²
8 029 €
6 438 €
6 402 €
6 401 €
6 245 €
6 215 €
6 104 €
6 016 €
5 778 €
5 526 €
City
name
Descending orderApartments
apt.
Price per m²
6 589 €
6 176 €
5 850 €
5 588 €
5 254 €
5 135 €
5 049 €
4 850 €
4 625 €
4 598 €

Least expensive cities

City
name
Ascending orderHouses
house
Price per m²
256 €
296 €
366 €
556 €
607 €
714 €
765 €
836 €
917 €
921 €
City
name
Ascending orderApartments
apt.
Price per m²
75 €
113 €
154 €
319 €
332 €
352 €
424 €
450 €
457 €
460 €