emooki
HomePrice mapTransactions
🇬🇧 English🇫🇷 Français🇩🇪 Deutsch🇪🇸 Español🇮🇹 Italiano

Real estate price map


Real estate price map in the municipality of Verrey-sous-Salmaise, choose a section to see transactions by parcel.

Côte-d'Or (21)

Verrey-sous-Salmaise - Real estate price m²

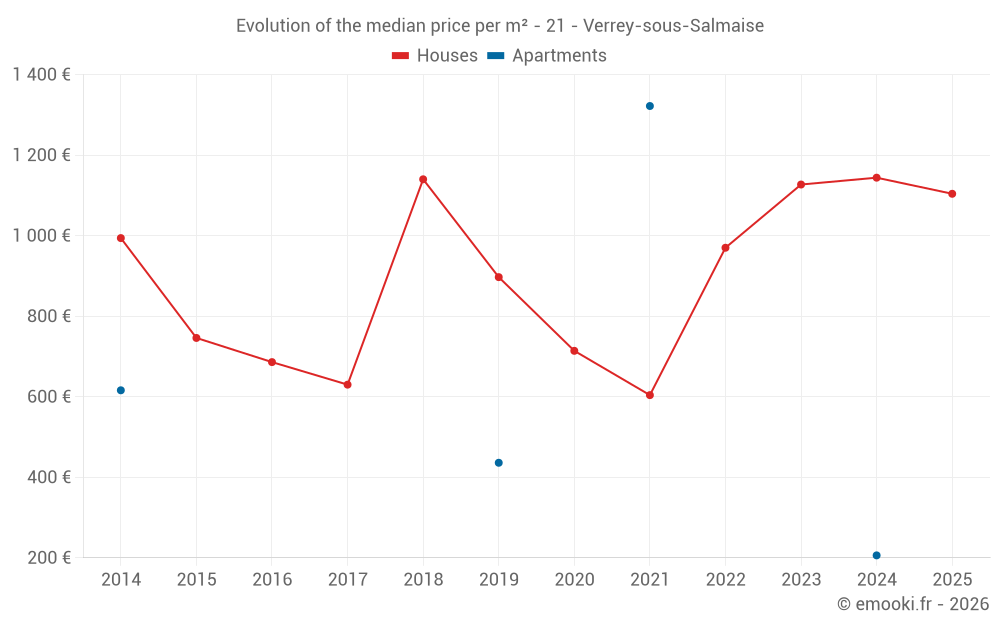
Median price of real estate
in the municipality of Verrey-sous-Salmaise

HousesHouses
1 111  /m²
1-23-45-67-89-10
Reliability 6/10
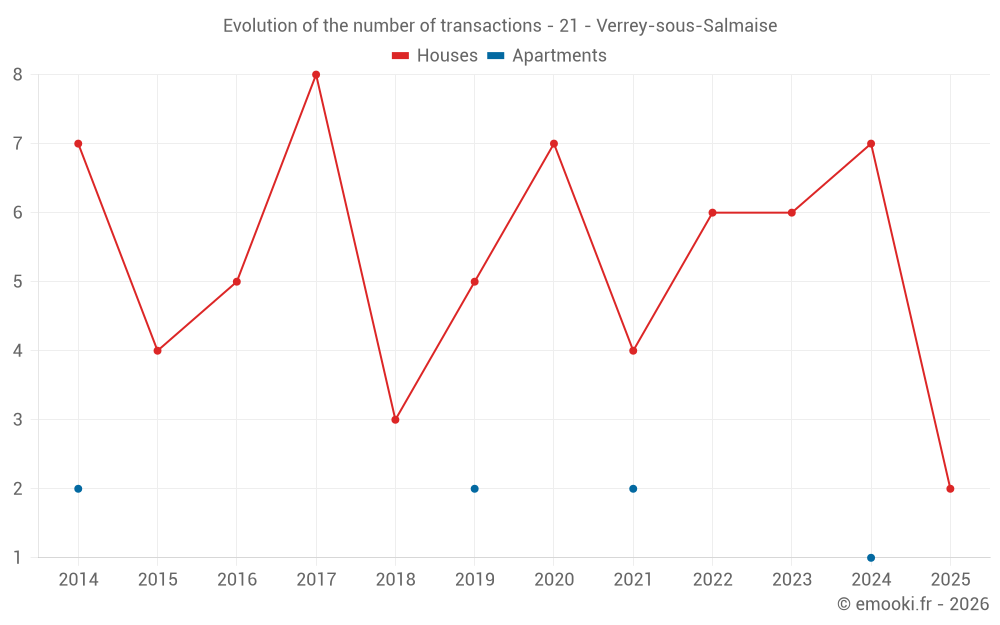
Median price on the 18 transactions of the last 36 months.
from 810 to
1 532  /m²
60% of transactions from the 2nd to the 8th deciles.
ApartmentsApartments
549  /m²
1-23-45-67-89-10
Reliability 2/10
Median price on the 5 transactions of the last 96 months.
DwellingsDwellings
1 078  /m²
1-23-45-67-89-10
Reliability 6/10
Median price on the 19 transactions of the last 36 months.
from 779 to
1 493  /m²
60% of transactions from the 2nd to the 8th deciles.

Yearly evolution

Evolution of the median price per m²

Evolution of the median price per m² - 21 - Verrey-sous-Salmaise

Evolution of the number of transactions

Warning, last year incomplete. Projections made based on the proportions between semesters of the previous year at the departmental/national level and by type of property.

Evolution of the number of transactions - 21 - Verrey-sous-Salmaise

Yearly data

Descending order
Year
Houses
house
transactions
Houses
house
Price per m²
Apartments
apt.
transactions
Apartments
apt.
Price per m²
2025
2
1 104 
0
--- 
2024
7
1 144 
1
206 
2023
6
1 127 
0
--- 
2022
6
970 
0
--- 
2021
4
604 
2
1 322 
2020
7
714 
0
--- 
2019
5
897 
2
436 
2018
3
1 140 
0
--- 
2017
8
630 
0
--- 
2016
5
686 
0
--- 
2015
4
746 
0
--- 
2014
7
994 
2
616 

Analysis

Structure of prices per m²

Values of price percentiles per m² over the periods used for the estimated price of each type of property.

Structure of transaction amounts

Values of transaction amounts percentiles over the periods used for the estimated price of each type of property.

Transaction amounts and prices per m² by percentile

Ascending order
Percentile
Houses
house
Price per m²
Houses
house
Transaction amount
Apartments
apt.
Price per m²
Apartments
apt.
Transaction amount
10th percentile
739 
42 525 
253 
20 000 
20th percentile
810 
47 800 
300 
20 000 
30th percentile
866 
58 800 
368 
20 500 
40th percentile
941 
75 000 
459 
21 500 
50th percentile
1 111 
100 K
549 
22 500 
60th percentile
1 306 
112 K
842 
34 520 
70th percentile
1 401 
138 K
1 135 
46 540 
80th percentile
1 532 
159 K
1 298 
54 840 
90th percentile
1 724 
191 K
1 330 
59 420 

National and departmental comparison

Evolution of the median price per m² of houses

Evolution of the median price per m² of apartments

Quarterly evolution

Evolution of the median price per m²

Evolution of the number of transactions

Quarterly data

Descending order
Quarter
Houses
house
transactions
Houses
house
Price per m²
Apartments
apt.
transactions
Apartments
apt.
Price per m²
2025 Q1
2
1 104 
0
--- 
2024 Q4
1
2 450 
1
206 
2024 Q3
3
1 144 
0
--- 
2024 Q2
2
1 160 
0
--- 
2024 Q1
1
827 
0
--- 
2023 Q3
3
950 
0
--- 
2023 Q2
2
1 136 
0
--- 
2023 Q1
1
1 304 
0
--- 
2022 Q4
1
1 078 
0
--- 
2022 Q3
2
1 089 
0
--- 
2022 Q2
2
1 032 
0
--- 
2022 Q1
1
577 
0
--- 
2021 Q4
2
564 
1
1 282 
2021 Q3
1
1 591 
0
--- 
2021 Q2
1
611 
1
1 362 
2020 Q2
4
962 
0
--- 
2020 Q1
3
635 
0
--- 
2019 Q3
1
897 
0
--- 
2019 Q2
3
1 257 
2
436 
2019 Q1
1
536 
0
--- 
2018 Q4
1
973 
0
--- 
2018 Q3
1
1 328 
0
--- 
2018 Q2
1
1 140 
0
--- 
2017 Q4
2
776 
0
--- 
2017 Q3
2
408 
0
--- 
2017 Q2
3
697 
0
--- 
2017 Q1
1
244 
0
--- 
2016 Q3
2
1 178 
0
--- 
2016 Q2
1
686 
0
--- 
2016 Q1
2
888 
0
--- 
2015 Q3
1
1 255 
0
--- 
2015 Q2
2
746 
0
--- 
2015 Q1
1
50 
0
--- 
2014 Q4
1
547 
1
415 
2014 Q3
3
1 286 
1
817 
2014 Q2
3
994 
0
--- 

Overview of the latest real estate transactions

The following list is an anonymized overview of the latest transactions. For more details and to find all transactions, please use the map to view transactions by plot or the transaction search page for a search by criteria.

2025-06-03
70 000 
2 800  /m²(25 m²)
Sale
Commercial property
25 m2
1 outbuilding
Land
65 m2
-Sols
3 outbuildings
Land
107 m2
-Sols
Land
288 m2
-Sols
2025-03-31
2 600 
Sale
Land
180 m2
-Jardins
Land
74 m2
-Landes
2025-03-26
35 000 
Sale
Land
56 m2
-Sols
2025-02-26
75 000 
798  /m²(94 m²)
Sale
Houses
House
5 rooms
94 m2
Land
600 m2
-Jardins
Land
600 m2
-Sols
2025-01-21
110 000 
1 410  /m²(78 m²)
Sale
Houses
House
4 rooms
78 m2
Land
480 m2
-Sols
2025-01-20
40 000 
Sale
3 outbuildings
Land
213 m2
-Sols
Land
87 m2
-Prés
2024-12-28
3 500 
1  /m²(3500 m²)
Sale
Commercial property
3500 m2
Land
3513 m2
-Prés
2024-11-20
321 000 
2 450  /m²(131 m²)
Sale
Houses
House
5 rooms
131 m2
1 outbuilding
Land
2768 m2
-Sols
Land
826 m2
-Prés
Land
10 m2
-Sols
Land
10145 m2
-Prés
2024-11-14
20 000 
206  /m²(97 m²)
Sale
Apartments
Apartment
3 rooms
47 m2
Apartments
Apartment
2 rooms
50 m2
4 outbuildings
2024-09-24
140 000 
1 609  /m²(87 m²)
Sale
Houses
House
4 rooms
87 m2
3 outbuildings
Land
471 m2
-Sols
2024-09-13
55 000 
714  /m²(77 m²)
Sale
Houses
House
4 rooms
77 m2
Land
129 m2
-Sols
Land
197 m2
-Terres
Land
148 m2
-Sols
2024-09-06
103 000 
1 144  /m²(90 m²)
Sale
Houses
House
2 rooms
90 m2
Land
290 m2
-Sols
Land
108 m2
-Sols
2024-05-29
160 050 
1 416  /m²(113 m²)
Sale
Houses
House
5 rooms
113 m2
1 outbuilding
Land
966 m2
-Sols
2024-05-02
57 000 
905  /m²(63 m²)
Sale
Houses
House
3 rooms
63 m2
2 outbuildings
Land
265 m2
-Sols
2024-03-26
38 000 
Sale
Land
1571 m2
-Terrains à bâtir
2024-03-21
1 248 
Sale
Land
1339 m2
-Terres
Land
1145 m2
-Taillis simples
Land
3007 m2
-Terres
Land
3648 m2
-Taillis simples
2024-02-22
43 000 
827  /m²(52 m²)
Sale
Houses
House
3 rooms
52 m2
Land
92 m2
-Sols
Land
108 m2
-Sols
Land
15 m2
-Sols
Land
1045 m2
-Vergers
2023-12-20
3 000 
Sale
Land
2627 m2
-Terres
2023-10-13
159 000 
1 710  /m²(93 m²)
Sale
Commercial property
93 m2
Land
500 m2
-Sols
Land
955 m2
-Jardins
2023-09-29
42 000 
750  /m²(56 m²)
Sale
Houses
House
4 rooms
56 m2
Land
40 m2
-Sols
1 outbuilding
Land
10 m2
-Sols
116 transactions listed in the municipality

Côte-d'Or (21)

Most expensive cities

City
name
Descending orderHouses
house
Price per m²
3 333 
3 264 
3 218 
3 137 
3 105 
3 047 
3 030 
City
name
Descending orderApartments
apt.
Price per m²
3 394 
3 012 
2 886 
2 846 

Least expensive cities

City
name
Ascending orderHouses
house
Price per m²
210 
225 
250 
274 
287 
287 
357 
City
name
Ascending orderApartments
apt.
Price per m²
58 
65 
74 
79 
112