emooki
HomePrice mapTransactions
🇬🇧 English🇫🇷 Français🇩🇪 Deutsch🇪🇸 Español🇮🇹 Italiano

Real estate price map


Real estate price map in the municipality of Til-Châtel.

Côte-d'Or (21)
Til-Châtel

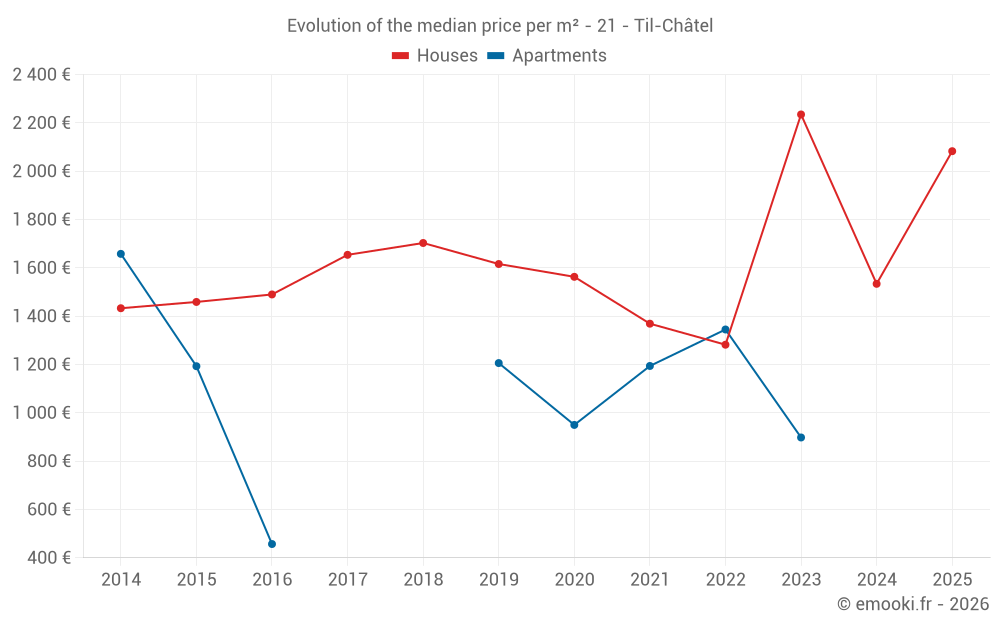
Median price of real estate
in the municipality of Til-Châtel

HousesHouses
1 762  /m²
1-23-45-67-89-10
Reliability 7/10
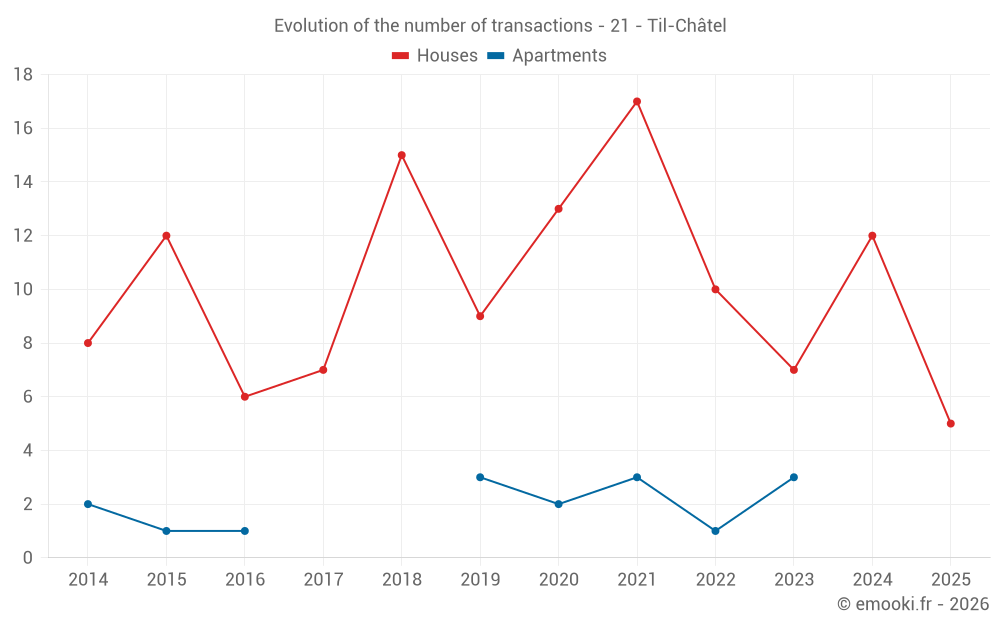
Median price on the 22 transactions of the last 24 months.
from 1 463 to
2 217  /m²
60% of transactions from the 2nd to the 8th deciles.
ApartmentsApartments
1 131  /m²
1-23-45-67-89-10
Reliability 4/10
Median price on the 8 transactions of the last 60 months.
DwellingsDwellings
1 743  /m²
1-23-45-67-89-10
Reliability 7/10
Median price on the 23 transactions of the last 24 months.
from 1 397 to
2 199  /m²
60% of transactions from the 2nd to the 8th deciles.
HousesEvolution of the price per m² of houses since...
1 year
+36%
2 years
-6.8%
3 years
+62%
4 years
+52%
5 years
+33%
6 years
+29%
7 years
+22%
8 years
+26%
9 years
+40%
10 years
+43%
11 years
+45%
ApartmentsEvolution of the price per m² of apartments since...
1 year
--
2 years
--
3 years
--
4 years
--
5 years
--
6 years
--
7 years
--
8 years
--
9 years
--
10 years
--
11 years
--

Yearly evolution

Evolution of the median price per m²

Evolution of the number of transactions

Warning, last year incomplete. Projections made based on the proportions between semesters of the previous year at the departmental/national level and by type of property.

Yearly data

Descending order
Year
Houses
house
transactions
Houses
house
Price per m²
Apartments
apt.
transactions
Apartments
apt.
Price per m²
2025
5
2 083 
0
--- 
2024
12
1 534 
0
--- 
2023
7
2 235 
3
898 
2022
10
1 282 
1
1 345 
2021
17
1 369 
3
1 194 
2020
13
1 563 
2
950 
2019
9
1 616 
3
1 206 
2018
15
1 703 
0
--- 
2017
7
1 654 
0
--- 
2016
6
1 490 
1
457 
2015
12
1 459 
1
1 193 
2014
8
1 433 
2
1 658 

Analysis

Structure of prices per m²

Values of price percentiles per m² over the periods used for the estimated price of each type of property.

Structure of transaction amounts

Values of transaction amounts percentiles over the periods used for the estimated price of each type of property.

Transaction amounts and prices per m² by percentile

Ascending order
Percentile
Houses
house
Price per m²
Houses
house
Transaction amount
Apartments
apt.
Price per m²
Apartments
apt.
Transaction amount
10th percentile
1 103 
121 K
679 
74 000 
20th percentile
1 463 
166 K
788 
80 320 
30th percentile
1 517 
179 K
915 
84 825 
40th percentile
1 684 
195 K
1 034 
113 K
50th percentile
1 762 
213 K
1 131 
123 K
60th percentile
1 971 
231 K
1 224 
126 K
70th percentile
2 123 
253 K
1 330 
131 K
80th percentile
2 217 
268 K
1 836 
140 K
90th percentile
2 409 
294 K
2 228 
179 K

National and departmental comparison

Evolution of the median price per m² of houses

Evolution of the median price per m² of apartments

Quarterly evolution

Evolution of the median price per m²

Evolution of the number of transactions

Quarterly data

Descending order
Quarter
Houses
house
transactions
Houses
house
Price per m²
Apartments
apt.
transactions
Apartments
apt.
Price per m²
2025 Q1
5
2 083 
0
--- 
2024 Q4
4
1 618 
0
--- 
2024 Q3
3
1 575 
0
--- 
2024 Q2
2
1 560 
0
--- 
2024 Q1
3
916 
0
--- 
2023 Q4
2
2 235 
1
898 
2023 Q3
3
2 235 
0
--- 
2023 Q2
2
1 852 
2
1 380 
2022 Q4
4
1 554 
1
1 345 
2022 Q3
1
1 341 
0
--- 
2022 Q2
3
981 
0
--- 
2022 Q1
2
1 228 
0
--- 
2021 Q4
2
1 478 
2
1 722 
2021 Q3
5
1 369 
1
1 194 
2021 Q2
5
2 110 
0
--- 
2021 Q1
5
1 228 
0
--- 
2020 Q4
3
1 563 
1
714 
2020 Q3
5
2 025 
0
--- 
2020 Q2
3
1 172 
0
--- 
2020 Q1
2
1 224 
1
1 187 
2019 Q4
1
2 533 
1
1 721 
2019 Q3
3
1 463 
2
1 121 
2019 Q2
2
1 440 
0
--- 
2019 Q1
3
1 616 
0
--- 
2018 Q4
2
798 
0
--- 
2018 Q3
6
1 824 
0
--- 
2018 Q2
7
1 566 
0
--- 
2017 Q3
3
1 366 
0
--- 
2017 Q2
1
2 000 
0
--- 
2017 Q1
3
1 654 
0
--- 
2016 Q4
2
1 662 
0
--- 
2016 Q3
2
1 286 
0
--- 
2016 Q2
1
905 
1
457 
2016 Q1
1
1 354 
0
--- 
2015 Q4
2
1 459 
0
--- 
2015 Q3
6
1 520 
0
--- 
2015 Q2
2
1 452 
1
1 193 
2015 Q1
2
1 132 
0
--- 
2014 Q4
2
1 542 
0
--- 
2014 Q3
5
1 440 
1
1 463 
2014 Q2
1
1 136 
0
--- 
2014 Q1
0
--- 
1
1 852 

Côte-d'Or (21)

Most expensive cities

City
name
Descending orderHouses
house
Price per m²
3 333 
3 264 
3 218 
3 137 
3 105 
3 047 
3 030 
City
name
Descending orderApartments
apt.
Price per m²
3 394 
3 012 
2 886 
2 846 

Least expensive cities

City
name
Ascending orderHouses
house
Price per m²
210 
225 
250 
274 
287 
287 
357 
City
name
Ascending orderApartments
apt.
Price per m²
58 
65 
74 
79 
112