emooki
HomePrice mapTransactions
🇬🇧 English🇫🇷 Français🇩🇪 Deutsch🇪🇸 Español🇮🇹 Italiano

Real estate price map


Real estate price map in the municipality of Talant, choose a section to see transactions by parcel.

Côte-d'Or (21)

Talant - Real estate price m²

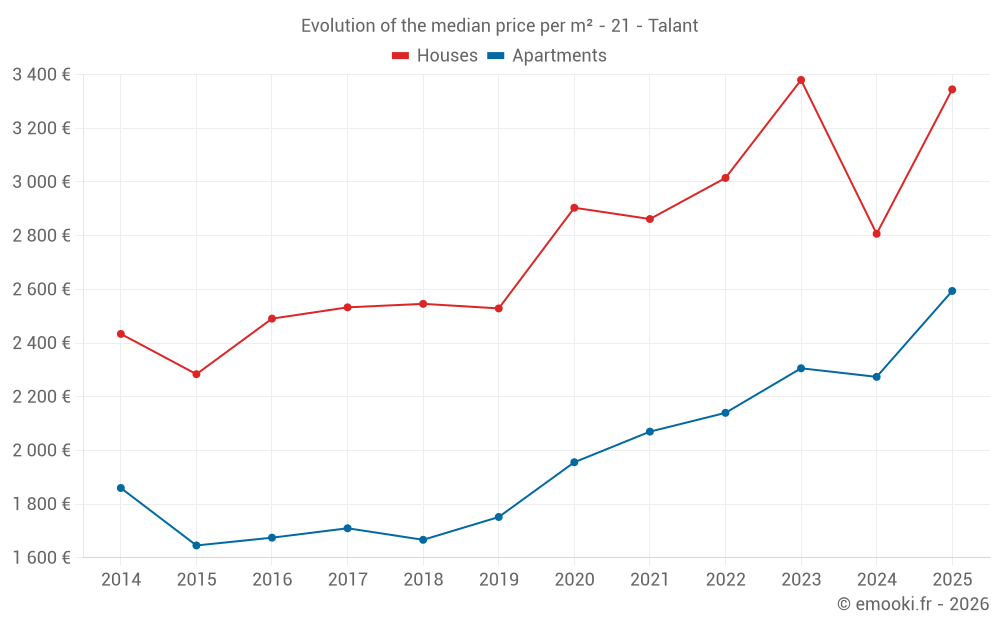
Median price of real estate
in the municipality of Talant

HousesHouses
3 030  /m²
1-23-45-67-89-10
Reliability 8/10
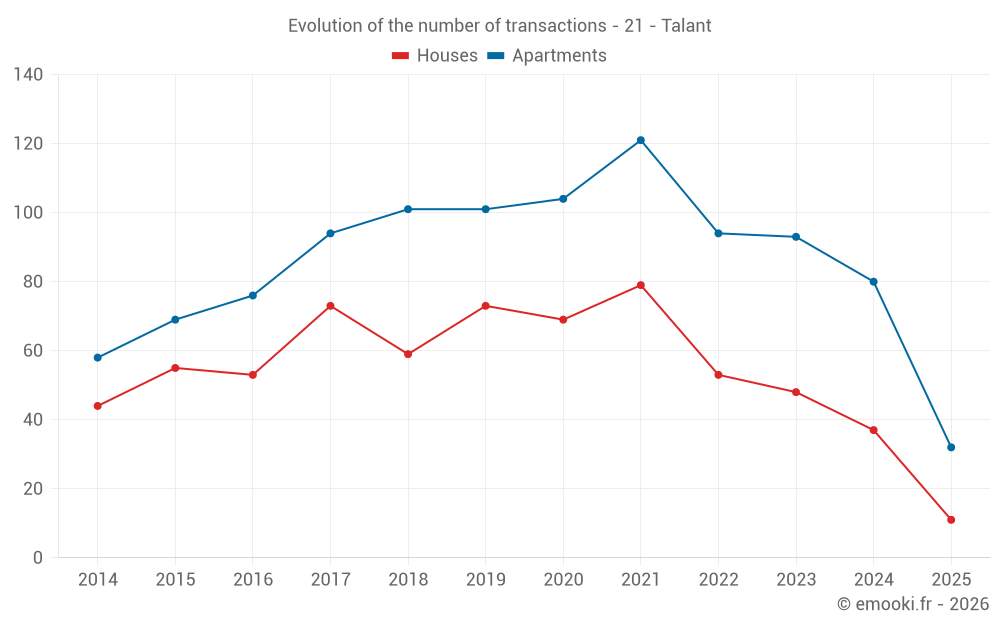
Median price on the 26 transactions of the last 12 months.
from 2 492 to
3 779  /m²
60% of transactions from the 2nd to the 8th deciles.
ApartmentsApartments
2 594  /m²
1-23-45-67-89-10
Reliability 9/10
Median price on the 32 transactions of the last 6 months.
from 1 951 to
3 061  /m²
60% of transactions from the 2nd to the 8th deciles.
DwellingsDwellings
2 722  /m²
1-23-45-67-89-10
Reliability 9/10
Median price on the 43 transactions of the last 6 months.
from 2 107 to
3 238  /m²
60% of transactions from the 2nd to the 8th deciles.
HousesEvolution of the price per m² of houses since...
1 year
+19%
2 years
-1%
3 years
+11%
4 years
+17%
5 years
+15%
6 years
+32%
7 years
+31%
8 years
+32%
9 years
+34%
10 years
+46%
11 years
+37%
The price per m² of houses has decreased by 1% since 2 years, but it has increased by 46% in 10 years.
ApartmentsEvolution of the price per m² of apartments since...
1 year
+14%
2 years
+12%
3 years
+21%
4 years
+25%
5 years
+33%
6 years
+48%
7 years
+56%
8 years
+52%
9 years
+55%
10 years
+58%
11 years
+39%

Yearly evolution

Evolution of the median price per m²

Evolution of the median price per m² - 21 - Talant

Evolution of the number of transactions

Warning, last year incomplete. Projections made based on the proportions between semesters of the previous year at the departmental/national level and by type of property.

Evolution of the number of transactions - 21 - Talant

Yearly data

Descending order
Year
Houses
house
transactions
Houses
house
Price per m²
Apartments
apt.
transactions
Apartments
apt.
Price per m²
2025
11
3 345 
32
2 594 
2024
37
2 807 
80
2 274 
2023
48
3 380 
93
2 306 
2022
53
3 015 
94
2 140 
2021
79
2 862 
121
2 070 
2020
69
2 904 
104
1 956 
2019
73
2 529 
101
1 752 
2018
59
2 546 
101
1 667 
2017
73
2 533 
94
1 710 
2016
53
2 491 
76
1 675 
2015
55
2 284 
69
1 646 
2014
44
2 434 
58
1 860 

Analysis

Structure of prices per m²

Values of price percentiles per m² over the periods used for the estimated price of each type of property.

Structure of transaction amounts

Values of transaction amounts percentiles over the periods used for the estimated price of each type of property.

Transaction amounts and prices per m² by percentile

Ascending order
Percentile
Houses
house
Price per m²
Houses
house
Transaction amount
Apartments
apt.
Price per m²
Apartments
apt.
Transaction amount
10th percentile
2 413 
215 K
1 571 
106 K
20th percentile
2 492 
250 K
1 951 
110 K
30th percentile
2 666 
282 K
2 173 
116 K
40th percentile
2 800 
332 K
2 394 
134 K
50th percentile
3 030 
387 K
2 594 
144 K
60th percentile
3 284 
395 K
2 744 
164 K
70th percentile
3 423 
461 K
2 974 
207 K
80th percentile
3 779 
485 K
3 061 
226 K
90th percentile
4 006 
573 K
3 163 
293 K

National and departmental comparison

Evolution of the median price per m² of houses

Evolution of the median price per m² of apartments

Quarterly evolution

Evolution of the median price per m²

Evolution of the number of transactions

Quarterly data

Descending order
Quarter
Houses
house
transactions
Houses
house
Price per m²
Apartments
apt.
transactions
Apartments
apt.
Price per m²
2025 Q2
1
3 779 
6
2 716 
2025 Q1
10
3 197 
26
2 494 
2024 Q4
7
3 012 
19
2 243 
2024 Q3
8
2 894 
23
2 321 
2024 Q2
7
3 313 
15
2 127 
2024 Q1
15
2 778 
23
2 294 
2023 Q4
5
3 470 
16
2 326 
2023 Q3
19
3 068 
28
2 559 
2023 Q2
11
3 927 
23
2 319 
2023 Q1
13
3 398 
26
2 118 
2022 Q4
10
3 657 
27
2 208 
2022 Q3
16
3 172 
32
2 290 
2022 Q2
12
2 571 
20
1 800 
2022 Q1
15
2 755 
15
2 359 
2021 Q4
12
2 912 
33
2 240 
2021 Q3
23
2 941 
23
2 300 
2021 Q2
19
2 786 
34
2 078 
2021 Q1
25
2 901 
31
1 688 
2020 Q4
20
2 998 
21
1 845 
2020 Q3
14
2 600 
31
2 000 
2020 Q2
13
2 624 
26
1 819 
2020 Q1
22
3 042 
26
2 082 
2019 Q4
27
2 452 
31
2 016 
2019 Q3
25
2 701 
22
1 769 
2019 Q2
11
2 807 
29
1 719 
2019 Q1
10
2 404 
19
1 571 
2018 Q4
20
2 418 
32
1 702 
2018 Q3
23
2 593 
23
1 706 
2018 Q2
10
2 658 
19
1 673 
2018 Q1
6
3 334 
27
1 600 
2017 Q4
17
2 533 
26
1 902 
2017 Q3
21
2 759 
25
1 577 
2017 Q2
22
2 484 
19
1 741 
2017 Q1
13
2 321 
24
1 703 
2016 Q4
16
2 742 
20
1 604 
2016 Q3
17
2 488 
21
1 712 
2016 Q2
9
2 347 
16
1 706 
2016 Q1
11
2 170 
19
1 650 
2015 Q4
13
2 470 
16
1 468 
2015 Q3
19
2 341 
16
1 782 
2015 Q2
16
2 156 
21
1 786 
2015 Q1
7
2 284 
16
1 602 
2014 Q4
11
2 226 
16
1 758 
2014 Q3
18
2 274 
17
1 725 
2014 Q2
5
2 688 
12
1 892 
2014 Q1
10
2 694 
13
2 091 

Overview of the latest real estate transactions

The following list is an anonymized overview of the latest transactions. For more details and to find all transactions, please use the map to view transactions by plot or the transaction search page for a search by criteria.

2025-06-06
255 000 
2 742  /m²(93 m²)
Sale
Apartments
Apartment
4 rooms
93 m2
2 outbuildings
2025-05-28
121 000 
2 689  /m²(45 m²)
Sale
Apartments
Apartment
2 rooms
45 m2
1 outbuilding
2025-05-27
483 651 
3 779  /m²(128 m²)
Sale
Houses
House
6 rooms
128 m2
Land
421 m2
-Sols
2025-05-20
69 000 
3 286  /m²(21 m²)
Sale
1 outbuilding
Apartments
Apartment
1 room
21 m2
2025-05-14
118 000 
2 360  /m²(50 m²)
Sale
Apartments
Apartment
2 rooms
50 m2
3 outbuildings
2025-05-12
215 000 
2 443  /m²(88 m²)
Sale
Apartments
Apartment
3 rooms
88 m2
2 outbuildings
2025-04-17
107 000 
3 147  /m²(34 m²)
Sale
Apartments
Apartment
1 room
34 m2
1 outbuilding
2025-04-14
15 000 
Sale
1 outbuilding
2025-04-04
19 000 
Sale
1 outbuilding
2025-04-04
95 000 
Sale
Land
468 m2
-Terrains à bâtir
2025-03-31
380 000 
2 484  /m²(153 m²)
Sale
Houses
House
7 rooms
153 m2
Land
796 m2
-Sols
2025-03-31
70 000 
Sale
Land
272 m2
-Terrains à bâtir
2025-03-31
149 245 
1 555  /m²(96 m²)
Sale
Apartments
Apartment
5 rooms
96 m2
1 outbuilding
1 outbuilding
2025-03-28
297 500 
3 165  /m²(94 m²)
Sale
2 outbuildings
Apartments
Apartment
4 rooms
94 m2
1 outbuilding
2025-03-28
250 000 
1 208  /m²(207 m²)
Exchange
Houses
House
6 rooms
110 m2
Land
440 m2
-Sols
Houses
House
5 rooms
97 m2
Land
337 m2
-Sols
2025-03-28
332 000 
3 423  /m²(97 m²)
Sale
Houses
House
6 rooms
97 m2
Land
471 m2
-Sols
2025-03-27
140 000 
2 154  /m²(65 m²)
Sale
Apartments
Apartment
4 rooms
65 m2
1 outbuilding
2025-03-27
170 000 
1 889  /m²(90 m²)
Sale
Apartments
Apartment
2 rooms
45 m2
Apartments
Apartment
2 rooms
45 m2
Land
67 m2
-Sols
2025-03-25
229 000 
2 863  /m²(80 m²)
Sale
Apartments
Apartment
4 rooms
80 m2
3 outbuildings
2025-03-25
155 800 
2 050  /m²(76 m²)
Sale
Apartments
Apartment
3 rooms
76 m2
2 outbuildings
2285 transactions listed in the municipality

Côte-d'Or (21)

Most expensive cities

City
name
Descending orderHouses
house
Price per m²
3 333 
3 264 
3 218 
3 137 
3 105 
3 047 
3 030 
City
name
Descending orderApartments
apt.
Price per m²
3 394 
3 012 
2 886 
2 846 

Least expensive cities

City
name
Ascending orderHouses
house
Price per m²
210 
225 
250 
274 
287 
287 
357 
City
name
Ascending orderApartments
apt.
Price per m²
58 
65 
74 
79 
112