emooki
HomePrice mapTransactions
🇬🇧 English🇫🇷 Français🇩🇪 Deutsch🇪🇸 Español🇮🇹 Italiano

Real estate price map


Real estate price map in the municipality of Quetigny, choose a section to see transactions by parcel.

Côte-d'Or (21)

Quetigny - Real estate price m²

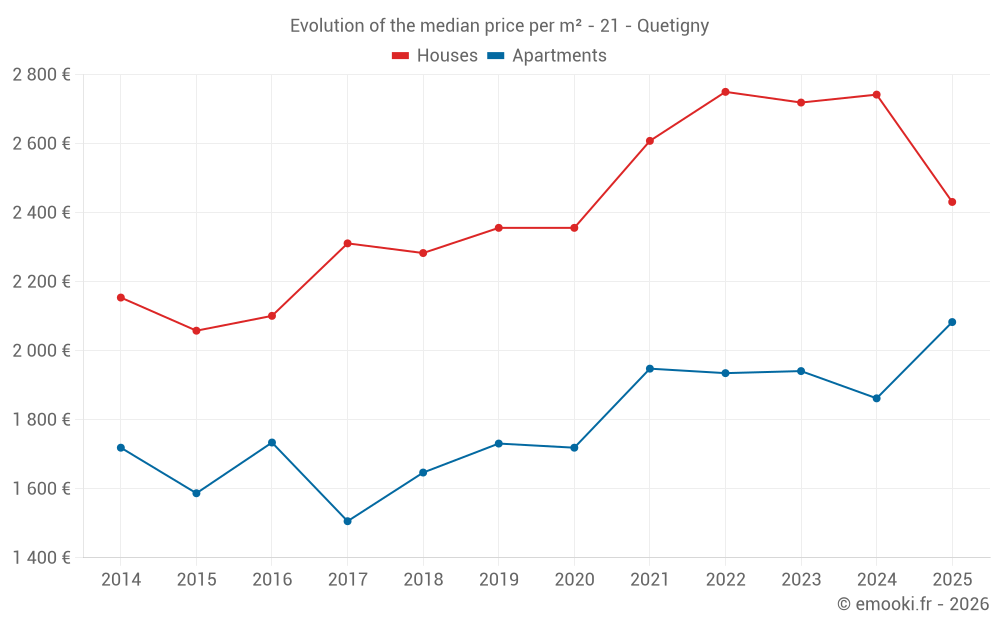
Median price of real estate
in the municipality of Quetigny

HousesHouses
2 702  /m²
1-23-45-67-89-10
Reliability 8/10
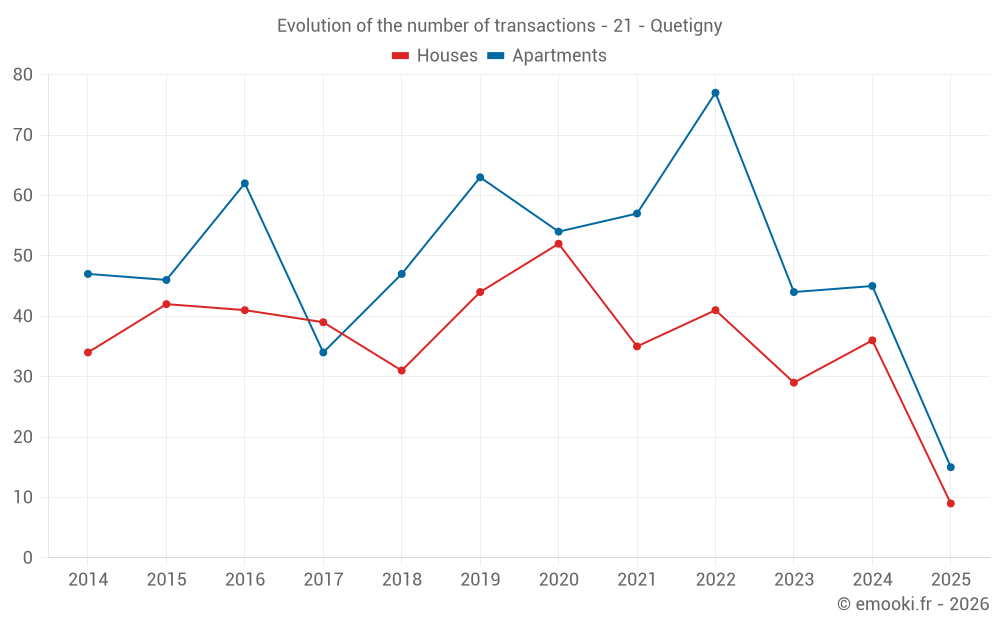
Median price on the 30 transactions of the last 12 months.
from 2 412 to
2 856  /m²
60% of transactions from the 2nd to the 8th deciles.
ApartmentsApartments
2 096  /m²
1-23-45-67-89-10
Reliability 8/10
Median price on the 42 transactions of the last 12 months.
from 1 517 to
2 592  /m²
60% of transactions from the 2nd to the 8th deciles.
DwellingsDwellings
2 284  /m²
1-23-45-67-89-10
Reliability 9/10
Median price on the 24 transactions of the last 6 months.
from 1 823 to
2 640  /m²
60% of transactions from the 2nd to the 8th deciles.
HousesEvolution of the price per m² of houses since...
1 year
-11%
2 years
-11%
3 years
-12%
4 years
-6.8%
5 years
+3.2%
6 years
+3.2%
7 years
+6.5%
8 years
+5.2%
9 years
+16%
10 years
+18%
11 years
+13%
The price per m² of houses has decreased by 12% since 3 years, but it has increased by 18% in 10 years.
ApartmentsEvolution of the price per m² of apartments since...
1 year
+12%
2 years
+7.3%
3 years
+7.6%
4 years
+6.9%
5 years
+21%
6 years
+20%
7 years
+26%
8 years
+38%
9 years
+20%
10 years
+31%
11 years
+21%

Yearly evolution

Evolution of the median price per m²

Evolution of the median price per m² - 21 - Quetigny

Evolution of the number of transactions

Warning, last year incomplete. Projections made based on the proportions between semesters of the previous year at the departmental/national level and by type of property.

Evolution of the number of transactions - 21 - Quetigny

Yearly data

Descending order
Year
Houses
house
transactions
Houses
house
Price per m²
Apartments
apt.
transactions
Apartments
apt.
Price per m²
2025
9
2 431 
15
2 083 
2024
36
2 742 
45
1 862 
2023
29
2 719 
44
1 941 
2022
41
2 750 
77
1 935 
2021
35
2 608 
57
1 948 
2020
52
2 356 
54
1 719 
2019
44
2 356 
63
1 731 
2018
31
2 283 
47
1 647 
2017
39
2 311 
34
1 506 
2016
41
2 101 
62
1 734 
2015
42
2 058 
46
1 587 
2014
34
2 154 
47
1 719 

Analysis

Structure of prices per m²

Values of price percentiles per m² over the periods used for the estimated price of each type of property.

Structure of transaction amounts

Values of transaction amounts percentiles over the periods used for the estimated price of each type of property.

Transaction amounts and prices per m² by percentile

Ascending order
Percentile
Houses
house
Price per m²
Houses
house
Transaction amount
Apartments
apt.
Price per m²
Apartments
apt.
Transaction amount
10th percentile
2 168 
190 K
1 420 
55 250 
20th percentile
2 412 
229 K
1 517 
79 180 
30th percentile
2 476 
235 K
1 784 
99 500 
40th percentile
2 641 
250 K
1 862 
116 K
50th percentile
2 702 
253 K
2 096 
127 K
60th percentile
2 742 
257 K
2 265 
137 K
70th percentile
2 789 
264 K
2 423 
146 K
80th percentile
2 856 
285 K
2 592 
169 K
90th percentile
3 171 
322 K
2 752 
195 K

National and departmental comparison

Evolution of the median price per m² of houses

Evolution of the median price per m² of apartments

Quarterly evolution

Evolution of the median price per m²

Evolution of the number of transactions

Quarterly data

Descending order
Quarter
Houses
house
transactions
Houses
house
Price per m²
Apartments
apt.
transactions
Apartments
apt.
Price per m²
2025 Q2
2
2 402 
7
2 083 
2025 Q1
7
2 431 
8
2 123 
2024 Q4
8
2 702 
10
2 391 
2024 Q3
13
2 745 
17
1 862 
2024 Q2
11
2 795 
14
1 898 
2024 Q1
4
2 571 
4
1 579 
2023 Q4
7
2 272 
5
1 894 
2023 Q3
11
2 835 
14
2 296 
2023 Q2
9
2 719 
10
1 933 
2023 Q1
2
2 752 
15
1 938 
2022 Q4
8
2 446 
18
2 274 
2022 Q3
15
2 731 
17
2 000 
2022 Q2
10
2 879 
17
1 932 
2022 Q1
8
2 598 
25
1 790 
2021 Q4
8
2 810 
19
1 950 
2021 Q3
14
2 500 
16
2 150 
2021 Q2
7
2 483 
12
1 868 
2021 Q1
6
2 698 
10
1 797 
2020 Q4
16
2 579 
15
1 692 
2020 Q3
16
2 227 
11
1 872 
2020 Q2
12
2 154 
14
1 884 
2020 Q1
8
2 329 
14
1 602 
2019 Q4
17
2 523 
17
2 032 
2019 Q3
13
2 265 
14
1 900 
2019 Q2
8
2 312 
17
1 628 
2019 Q1
6
2 217 
15
1 527 
2018 Q4
3
2 485 
7
1 325 
2018 Q3
14
2 293 
13
1 647 
2018 Q2
7
2 394 
13
1 672 
2018 Q1
7
2 000 
14
1 767 
2017 Q4
10
2 334 
6
1 400 
2017 Q3
12
2 394 
7
1 473 
2017 Q2
8
2 175 
10
1 949 
2017 Q1
9
2 422 
11
1 453 
2016 Q4
10
1 974 
21
1 636 
2016 Q3
20
2 216 
22
1 848 
2016 Q2
3
1 958 
9
1 515 
2016 Q1
8
1 871 
10
1 820 
2015 Q4
6
1 851 
17
1 365 
2015 Q3
20
2 076 
7
1 564 
2015 Q2
11
2 048 
13
1 800 
2015 Q1
5
2 265 
9
1 667 
2014 Q4
8
2 082 
8
2 004 
2014 Q3
10
2 431 
13
1 600 
2014 Q2
6
2 223 
14
1 698 
2014 Q1
10
2 007 
12
1 764 

Overview of the latest real estate transactions

The following list is an anonymized overview of the latest transactions. For more details and to find all transactions, please use the map to view transactions by plot or the transaction search page for a search by criteria.

2025-05-28
229 000 
2 101  /m²(109 m²)
Sale
Houses
House
5 rooms
109 m2
Land
197 m2
-Sols
2025-05-21
55 000 
1 774  /m²(31 m²)
Sale
Apartments
Apartment
1 room
31 m2
2 outbuildings
2025-05-19
156 900 
2 753  /m²(57 m²)
Sale
Apartments
Apartment
3 rooms
57 m2
1 outbuilding
2025-05-16
78 350 
2 304  /m²(34 m²)
Sale
Apartments
Apartment
2 rooms
34 m2
2 outbuildings
2025-05-14
484 
Sale
Land
22 m2
-Sols
2025-05-14
550 
Sale
Land
25 m2
-Sols
2025-05-14
2 000 
Sale
Land
11 m2
-Terrains à bâtir
2025-04-23
125 000 
2 083  /m²(60 m²)
Sale
Apartments
Apartment
3 rooms
60 m2
2 outbuildings
2025-04-22
227 000 
2 702  /m²(84 m²)
Sale
Houses
House
4 rooms
84 m2
Land
297 m2
-Sols
2025-04-18
57 500 
1 855  /m²(31 m²)
Sale
Apartments
Apartment
1 room
31 m2
2 outbuildings
2025-04-17
51 980 
2 599  /m²(20 m²)
Sale
Apartments
Apartment
1 room
20 m2
1 outbuilding
2025-04-11
53 000 
981  /m²(54 m²)
Sale
Apartments
Apartment
2 rooms
54 m2
1 outbuilding
2025-04-02
15 000 
Sale
1 outbuilding
2025-03-31
130 000 
1 327  /m²(98 m²)
Sale
Commercial property
98 m2
2025-03-31
190 000 
1 979  /m²(96 m²)
Sale
Apartments
Apartment
5 rooms
96 m2
2 outbuildings
2025-03-28
345 000 
3 165  /m²(109 m²)
Sale
Houses
House
4 rooms
109 m2
Land
518 m2
-Sols
2025-03-28
146 050 
3 246  /m²(45 m²)
Sale
Apartments
Apartment
2 rooms
45 m2
1 outbuilding
2025-03-26
254 030 
3 257  /m²(78 m²)
Sale
Houses
House
4 rooms
78 m2
2025-03-21
1 056 
Sale
Land
48 m2
-Sols
2025-03-20
2 600 000 
847  /m²(3070 m²)
Sale
Commercial property
3070 m2
Land
7692 m2
-Sols
Land
36 m2
-Sols
1664 transactions listed in the municipality

Côte-d'Or (21)

Most expensive cities

City
name
Descending orderHouses
house
Price per m²
3 333 
3 264 
3 218 
3 137 
3 105 
3 047 
3 030 
City
name
Descending orderApartments
apt.
Price per m²
3 394 
3 012 
2 886 
2 846 

Least expensive cities

City
name
Ascending orderHouses
house
Price per m²
210 
225 
250 
274 
287 
287 
357 
City
name
Ascending orderApartments
apt.
Price per m²
58 
65 
74 
79 
112