emooki
HomePrice mapTransactions
🇬🇧 English🇫🇷 Français🇩🇪 Deutsch🇪🇸 Español🇮🇹 Italiano

Real estate price map


Real estate price map in the municipality of Selongey, choose a section to see transactions by parcel.

Côte-d'Or (21)

Selongey - Real estate price m²

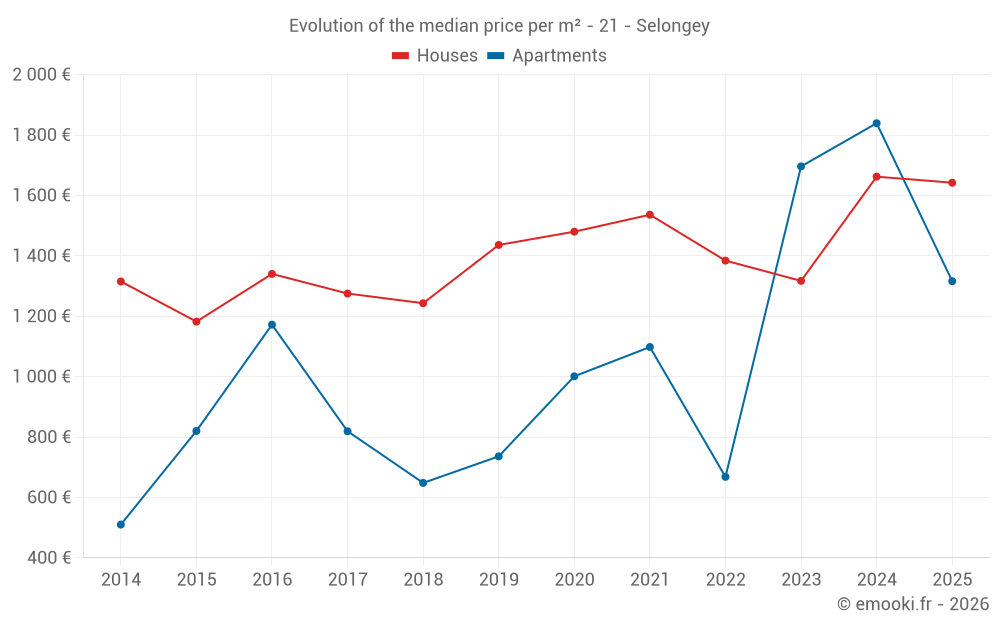
Median price of real estate
in the municipality of Selongey

HousesHouses
1 715  /m²
1-23-45-67-89-10
Reliability 8/10
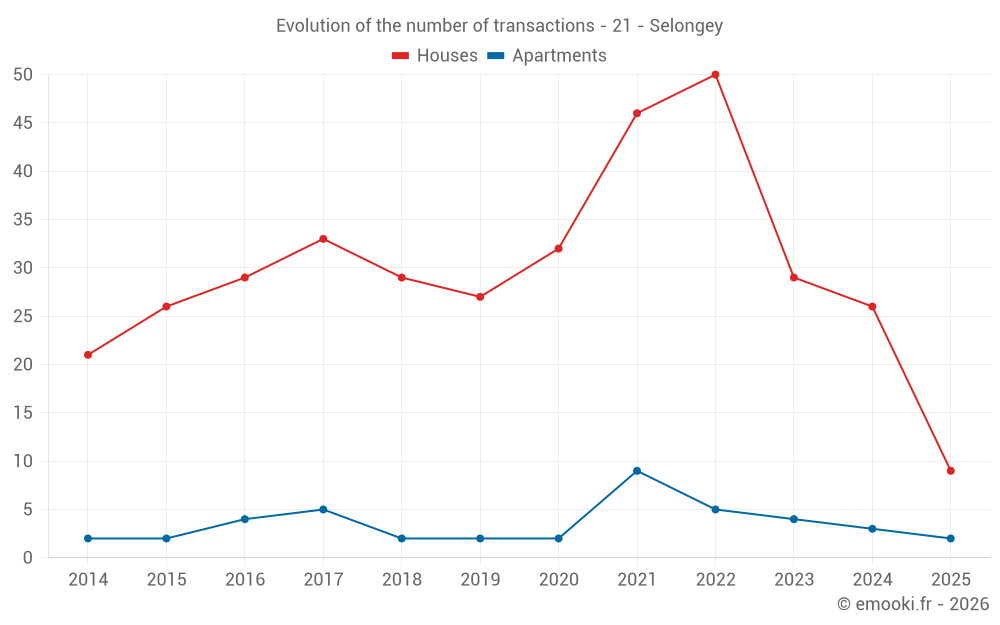
Median price on the 25 transactions of the last 12 months.
from 1 106 to
2 381  /m²
60% of transactions from the 2nd to the 8th deciles.
ApartmentsApartments
1 512  /m²
1-23-45-67-89-10
Reliability 6/10
Median price on the 12 transactions of the last 36 months.
from 741 to
1 832  /m²
60% of transactions from the 2nd to the 8th deciles.
DwellingsDwellings
1 642  /m²
1-23-45-67-89-10
Reliability 8/10
Median price on the 29 transactions of the last 12 months.
from 992 to
2 201  /m²
60% of transactions from the 2nd to the 8th deciles.
HousesEvolution of the price per m² of houses since...
1 year
-1.2%
2 years
+25%
3 years
+19%
4 years
+6.9%
5 years
+11%
6 years
+14%
7 years
+32%
8 years
+29%
9 years
+23%
10 years
+39%
11 years
+25%
The price per m² of houses has decreased by 1.2% since 1 year, but it has increased by 39% in 10 years.

Yearly evolution

Evolution of the median price per m²

Evolution of the median price per m² - 21 - Selongey

Evolution of the number of transactions

Warning, last year incomplete. Projections made based on the proportions between semesters of the previous year at the departmental/national level and by type of property.

Evolution of the number of transactions - 21 - Selongey

Yearly data

Descending order
Year
Houses
house
transactions
Houses
house
Price per m²
Apartments
apt.
transactions
Apartments
apt.
Price per m²
2025
9
1 642 
2
1 316 
2024
26
1 662 
3
1 839 
2023
29
1 317 
4
1 696 
2022
50
1 384 
5
668 
2021
46
1 536 
9
1 098 
2020
32
1 480 
2
1 001 
2019
27
1 436 
2
736 
2018
29
1 243 
2
648 
2017
33
1 275 
5
819 
2016
29
1 340 
4
1 172 
2015
26
1 182 
2
820 
2014
21
1 315 
2
510 

Analysis

Structure of prices per m²

Values of price percentiles per m² over the periods used for the estimated price of each type of property.

Structure of transaction amounts

Values of transaction amounts percentiles over the periods used for the estimated price of each type of property.

Transaction amounts and prices per m² by percentile

Ascending order
Percentile
Houses
house
Price per m²
Houses
house
Transaction amount
Apartments
apt.
Price per m²
Apartments
apt.
Transaction amount
10th percentile
660 
70 000 
522 
70 730 
20th percentile
1 106 
79 000 
741 
80 650 
30th percentile
1 404 
107 K
1 070 
84 465 
40th percentile
1 599 
152 K
1 272 
92 780 
50th percentile
1 715 
180 K
1 512 
102 K
60th percentile
1 928 
193 K
1 595 
108 K
70th percentile
2 046 
204 K
1 743 
128 K
80th percentile
2 381 
213 K
1 832 
151 K
90th percentile
2 712 
243 K
1 902 
164 K

National and departmental comparison

Evolution of the median price per m² of houses

Evolution of the median price per m² of apartments

Quarterly evolution

Evolution of the median price per m²

Evolution of the number of transactions

Quarterly data

Descending order
Quarter
Houses
house
transactions
Houses
house
Price per m²
Apartments
apt.
transactions
Apartments
apt.
Price per m²
2025 Q2
2
1 784 
1
1 031 
2025 Q1
7
1 364 
1
1 601 
2024 Q4
11
1 609 
0
--- 
2024 Q3
5
2 429 
2
1 108 
2024 Q2
7
1 468 
1
1 839 
2024 Q1
3
1 611 
0
--- 
2023 Q4
6
1 374 
0
--- 
2023 Q3
9
1 000 
1
4 559 
2023 Q2
4
709 
1
1 804 
2023 Q1
10
1 412 
2
1 374 
2022 Q4
11
1 353 
2
1 052 
2022 Q3
17
1 281 
1
506 
2022 Q2
14
1 384 
1
889 
2022 Q1
8
1 468 
1
635 
2021 Q4
16
1 559 
1
1 721 
2021 Q3
11
1 627 
2
786 
2021 Q2
14
1 164 
5
1 098 
2021 Q1
5
667 
1
1 768 
2020 Q4
10
1 454 
1
1 111 
2020 Q3
6
1 390 
0
--- 
2020 Q2
8
1 432 
1
891 
2020 Q1
8
1 565 
0
--- 
2019 Q4
6
1 528 
0
--- 
2019 Q3
9
1 709 
1
1 319 
2019 Q2
5
1 284 
1
154 
2019 Q1
7
1 179 
0
--- 
2018 Q4
10
1 033 
1
238 
2018 Q3
5
1 426 
0
--- 
2018 Q2
6
1 698 
1
1 059 
2018 Q1
8
1 168 
0
--- 
2017 Q4
7
1 315 
2
868 
2017 Q3
8
1 276 
1
1 167 
2017 Q2
14
1 074 
2
628 
2017 Q1
4
1 290 
0
--- 
2016 Q4
7
1 576 
1
102 
2016 Q3
7
1 239 
0
--- 
2016 Q2
5
1 036 
1
1 276 
2016 Q1
10
1 326 
2
1 325 
2015 Q4
7
1 190 
0
--- 
2015 Q3
7
1 620 
0
--- 
2015 Q2
8
1 112 
1
929 
2015 Q1
4
1 130 
1
710 
2014 Q4
4
669 
2
510 
2014 Q3
8
1 524 
0
--- 
2014 Q2
4
972 
0
--- 
2014 Q1
5
1 716 
0
--- 

Overview of the latest real estate transactions

The following list is an anonymized overview of the latest transactions. For more details and to find all transactions, please use the map to view transactions by plot or the transaction search page for a search by criteria.

2025-06-23
45 000 
Sale
Land
563 m2
-Terres
2025-06-03
21 300 
Sale
Land
402 m2
-Terres
2025-05-28
22 025 
Sale
Land
3720 m2
-Terres
Land
685 m2
-Taillis simples
/Acacias
2025-05-26
1 500 
Sale
Land
3610 m2
-Terres
Land
4760 m2
-Terres
Land
751 m2
-Jardins
2025-05-23
352 000 
1 853  /m²(190 m²)
Sale
Houses
House
6 rooms
190 m2
1 outbuilding
Land
830 m2
-Sols
Land
821 m2
-Sols
2025-05-13
1 010 
Sale
Land
625 m2
-Landes
/Patis
Land
3413 m2
-Terres
2025-04-25
1 470 
Sale
Land
1700 m2
-Futaies résineuses
Land
540 m2
-Terres
Land
1660 m2
-Terres
Land
1000 m2
-Landes
2025-04-22
106 300 
1 715  /m²(62 m²)
Sale
Land
13 m2
-Sols
Houses
House
3 rooms
62 m2
Land
212 m2
-Sols
2 outbuildings
Land
19 m2
-Sols
2025-04-15
165 000 
1 031  /m²(160 m²)
Sale
Apartments
Apartment
4 rooms
95 m2
Apartments
Apartment
3 rooms
65 m2
3 outbuildings
Land
281 m2
-Sols
2025-03-28
13 842 
Sale
Land
2307 m2
-Terrains à bâtir
2025-03-25
15 000 
134  /m²(112 m²)
Sale
Houses
House
4 rooms
112 m2
1 outbuilding
2025-03-19
200 
Sale
Land
440 m2
-Taillis simples
2025-03-14
5 000 
Sale
Land
8390 m2
-Terres
2025-03-05
200 
Sale
Land
500 m2
-Taillis simples
2025-02-25
110 000 
1 642  /m²(67 m²)
Sale
Houses
House
4 rooms
67 m2
1 outbuilding
Land
591 m2
-Sols
2025-02-17
233 500 
2 715  /m²(86 m²)
Sale
Houses
House
4 rooms
86 m2
2025-02-07
500 
4  /m²(120 m²)
Sale
Houses
House
5 rooms
120 m2
1 outbuilding
Land
231 m2
-Sols
Land
7 m2
-Sols
2025-02-07
1 
Exchange
Land
21 m2
-Terres
Land
21 m2
-Terres
2025-02-07
13 000 
Sale
Land
517 m2
-Terres
Land
21 m2
-Terres
2025-02-03
206 750 
1 149  /m²(180 m²)
Sale
Houses
House
7 rooms
180 m2
Land
1528 m2
-Sols
Land
1456 m2
-Terres
739 transactions listed in the municipality

Côte-d'Or (21)

Most expensive cities

City
name
Descending orderHouses
house
Price per m²
3 333 
3 264 
3 218 
3 137 
3 105 
3 047 
3 030 
City
name
Descending orderApartments
apt.
Price per m²
3 394 
3 012 
2 886 
2 846 

Least expensive cities

City
name
Ascending orderHouses
house
Price per m²
210 
225 
250 
274 
287 
287 
357 
City
name
Ascending orderApartments
apt.
Price per m²
58 
65 
74 
79 
112