emooki
HomePrice mapTransactions
🇬🇧 English🇫🇷 Français🇩🇪 Deutsch🇪🇸 Español🇮🇹 Italiano

Real estate price map


Real estate price map in the municipality of Couchey, choose a section to see transactions by parcel.

Côte-d'Or (21)

Couchey - Real estate price m²

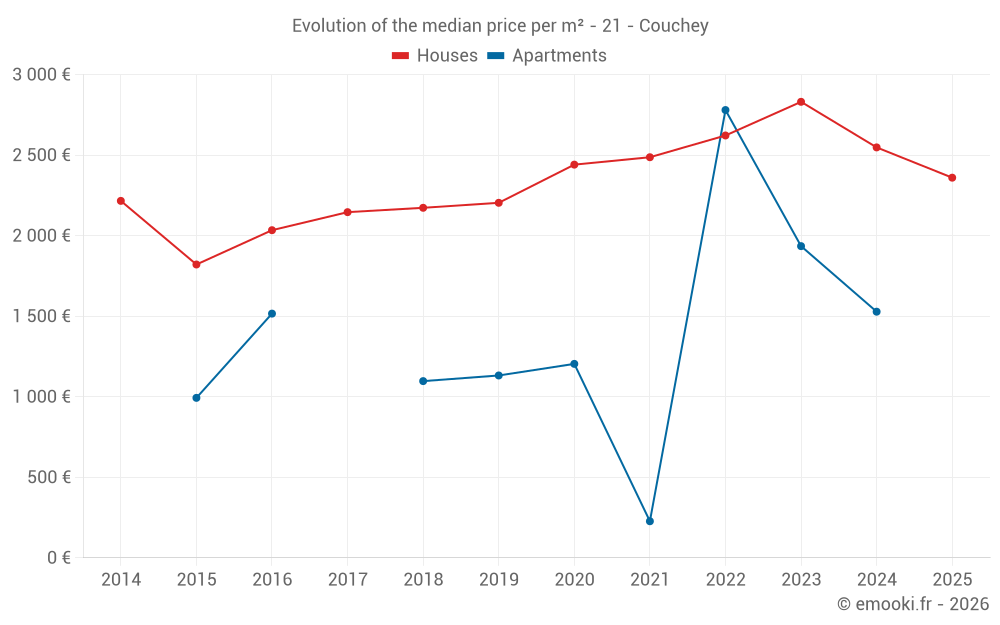
Median price of real estate
in the municipality of Couchey

HousesHouses
2 548  /m²
1-23-45-67-89-10
Reliability 8/10
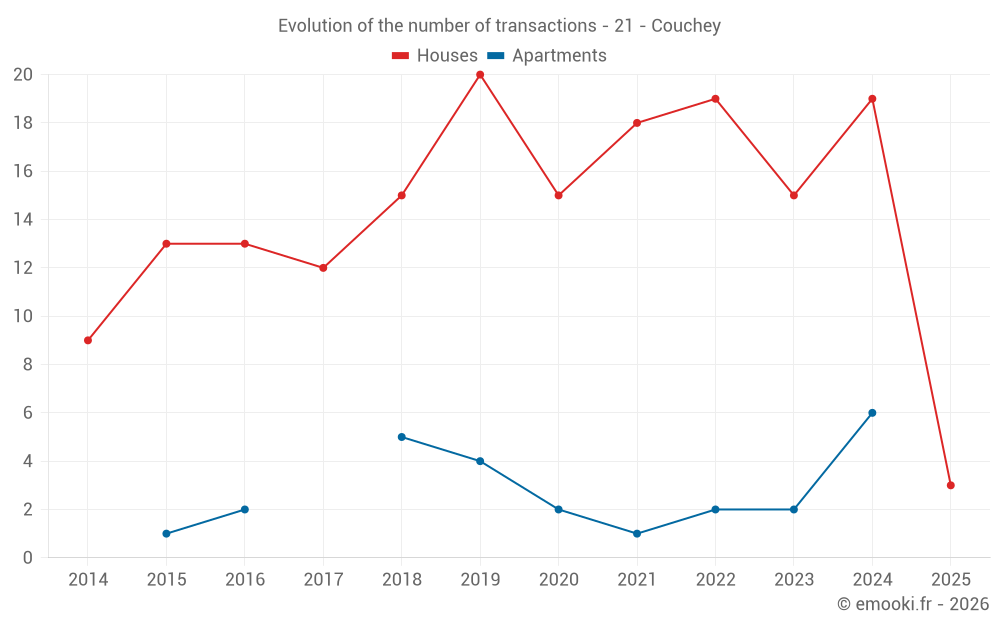
Median price on the 17 transactions of the last 12 months.
from 1 907 to
2 765  /m²
60% of transactions from the 2nd to the 8th deciles.
ApartmentsApartments
1 910  /m²
1-23-45-67-89-10
Reliability 5/10
Median price on the 11 transactions of the last 48 months.
from 889 to
2 704  /m²
60% of transactions from the 2nd to the 8th deciles.
DwellingsDwellings
2 411  /m²
1-23-45-67-89-10
Reliability 8/10
Median price on the 22 transactions of the last 12 months.
from 1 286 to
2 719  /m²
60% of transactions from the 2nd to the 8th deciles.

Yearly evolution

Evolution of the median price per m²

Evolution of the median price per m² - 21 - Couchey

Evolution of the number of transactions

Warning, last year incomplete. Projections made based on the proportions between semesters of the previous year at the departmental/national level and by type of property.

Evolution of the number of transactions - 21 - Couchey

Yearly data

Descending order
Year
Houses
house
transactions
Houses
house
Price per m²
Apartments
apt.
transactions
Apartments
apt.
Price per m²
2025
3
2 360 
0
--- 
2024
19
2 548 
6
1 528 
2023
15
2 831 
2
1 935 
2022
19
2 622 
2
2 780 
2021
18
2 487 
1
227 
2020
15
2 441 
2
1 204 
2019
20
2 204 
4
1 132 
2018
15
2 173 
5
1 097 
2017
12
2 146 
0
--- 
2016
13
2 034 
2
1 516 
2015
13
1 821 
1
993 
2014
9
2 216 
0
--- 

Analysis

Structure of prices per m²

Values of price percentiles per m² over the periods used for the estimated price of each type of property.

Structure of transaction amounts

Values of transaction amounts percentiles over the periods used for the estimated price of each type of property.

Transaction amounts and prices per m² by percentile

Ascending order
Percentile
Houses
house
Price per m²
Houses
house
Transaction amount
Apartments
apt.
Price per m²
Apartments
apt.
Transaction amount
10th percentile
1 518 
161 K
828 
73 000 
20th percentile
1 907 
182 K
889 
78 000 
30th percentile
2 237 
198 K
1 145 
82 000 
40th percentile
2 401 
224 K
1 270 
110 K
50th percentile
2 548 
237 K
1 910 
120 K
60th percentile
2 634 
263 K
2 200 
130 K
70th percentile
2 657 
298 K
2 600 
150 K
80th percentile
2 765 
330 K
2 704 
160 K
90th percentile
3 286 
358 K
2 733 
160 K

National and departmental comparison

Evolution of the median price per m² of houses

Evolution of the median price per m² of apartments

Quarterly evolution

Evolution of the median price per m²

Evolution of the number of transactions

Quarterly data

Descending order
Quarter
Houses
house
transactions
Houses
house
Price per m²
Apartments
apt.
transactions
Apartments
apt.
Price per m²
2025 Q2
1
2 655 
0
--- 
2025 Q1
2
2 316 
0
--- 
2024 Q4
7
2 612 
1
2 200 
2024 Q3
7
2 548 
4
1 017 
2024 Q2
4
2 510 
1
1 910 
2024 Q1
1
2 689 
0
--- 
2023 Q4
2
2 565 
0
--- 
2023 Q3
7
3 154 
1
2 600 
2023 Q2
3
2 261 
0
--- 
2023 Q1
3
2 604 
1
1 270 
2022 Q4
3
2 856 
0
--- 
2022 Q3
9
2 588 
1
2 704 
2022 Q2
6
3 023 
1
2 857 
2022 Q1
1
854 
0
--- 
2021 Q4
3
2 585 
1
227 
2021 Q3
5
2 589 
0
--- 
2021 Q2
9
2 474 
0
--- 
2021 Q1
1
2 073 
0
--- 
2020 Q4
3
2 254 
1
1 496 
2020 Q3
5
2 563 
1
912 
2020 Q2
4
2 564 
0
--- 
2020 Q1
3
2 298 
0
--- 
2019 Q4
3
1 910 
2
1 132 
2019 Q3
5
2 030 
1
665 
2019 Q2
7
2 352 
1
1 868 
2019 Q1
5
2 474 
0
--- 
2018 Q4
3
2 417 
0
--- 
2018 Q3
8
2 112 
3
824 
2018 Q2
4
2 116 
1
1 097 
2018 Q1
0
--- 
1
2 200 
2017 Q4
2
2 918 
0
--- 
2017 Q3
2
1 682 
0
--- 
2017 Q2
6
2 146 
0
--- 
2017 Q1
2
2 092 
0
--- 
2016 Q4
1
2 261 
0
--- 
2016 Q3
5
1 920 
0
--- 
2016 Q2
5
2 177 
1
1 914 
2016 Q1
2
1 222 
1
1 118 
2015 Q4
3
1 911 
0
--- 
2015 Q3
2
1 770 
0
--- 
2015 Q2
5
1 821 
1
993 
2015 Q1
3
1 768 
0
--- 
2014 Q4
4
2 346 
0
--- 
2014 Q2
4
2 184 
0
--- 
2014 Q1
1
2 010 
0
--- 

Overview of the latest real estate transactions

The following list is an anonymized overview of the latest transactions. For more details and to find all transactions, please use the map to view transactions by plot or the transaction search page for a search by criteria.

2025-05-28
27 800 
Sale
Land
160 m2
-Terres
2025-04-09
292 000 
2 655  /m²(110 m²)
Sale
Houses
House
7 rooms
110 m2
Land
573 m2
-Sols
2025-04-04
29 484 
Sale
Land
448 m2
-Vignes
/Vins d'appellation d'origine contrôlée
Land
2670 m2
-Vignes
/Vins d'appellation d'origine contrôlée
2025-03-06
200 000 
2 273  /m²(88 m²)
Sale
Houses
House
5 rooms
88 m2
Land
366 m2
-Sols
2025-02-10
885 000 
163  /m²(5429 m²)
Sale
Commercial property
5429 m2
Land
405 m2
-Sols
Land
1497 m2
-Sols
Land
2405 m2
-Sols
Land
7348 m2
-Sols
2025-02-05
221 800 
2 360  /m²(94 m²)
Sale
Houses
House
5 rooms
94 m2
Land
288 m2
-Sols
2024-12-23
110 000 
2 200  /m²(50 m²)
Sale
Apartments
Apartment
3 rooms
50 m2
Land
37 m2
-Sols
Land
101 m2
-Sols
2024-12-23
2 500 
Sale
Land
1015 m2
-Landes
2024-12-18
80 000 
1 111  /m²(72 m²)
Sale
Houses
House
4 rooms
72 m2
Land
47 m2
-Sols
2024-12-11
140 444 
1 170  /m²(120 m²)
Sale
1 outbuilding
Land
32 m2
-Sols
Houses
House
4 rooms
120 m2
Land
58 m2
-Sols
Land
23 m2
-Sols
2024-12-09
253 450 
3 168  /m²(80 m²)
Sale
Houses
House
4 rooms
80 m2
Land
578 m2
-Sols
2024-12-06
333 000 
3 700  /m²(90 m²)
Sale
Land
35 m2
-Sols
Houses
House
5 rooms
90 m2
1 outbuilding
Land
504 m2
-Sols
2024-11-08
100 000 
Sale
Land
45 m2
-Terrains d'agrément
Land
193 m2
-Sols
Land
136 m2
-Vergers
2024-11-08
175 000 
2 612  /m²(67 m²)
Sale
Land
73 m2
-Terrains d'agrément
Houses
House
4 rooms
67 m2
Land
461 m2
-Sols
Land
554 m2
-Vergers
2024-11-06
357 500 
2 648  /m²(135 m²)
Sale
Houses
House
4 rooms
135 m2
Land
987 m2
-Sols
Land
99 m2
-Sols
2024-10-16
180 000 
2 093  /m²(86 m²)
Sale
Houses
House
5 rooms
86 m2
Land
360 m2
-Sols
2024-10-15
4 300 
Sale
Land
412 m2
-Terres
2024-10-09
12 000 
Sale
Land
1717 m2
-Vergers
2024-09-26
82 000 
2 733  /m²(30 m²)
Sale
Apartments
Apartment
2 rooms
30 m2
1 outbuilding
2024-09-06
130 000 
Sale
4 outbuildings
406 transactions listed in the municipality

Côte-d'Or (21)

Most expensive cities

City
name
Descending orderHouses
house
Price per m²
3 333 
3 264 
3 218 
3 137 
3 105 
3 047 
3 030 
City
name
Descending orderApartments
apt.
Price per m²
3 394 
3 012 
2 886 
2 846 

Least expensive cities

City
name
Ascending orderHouses
house
Price per m²
210 
225 
250 
274 
287 
287 
357 
City
name
Ascending orderApartments
apt.
Price per m²
58 
65 
74 
79 
112