emooki
HomePrice mapTransactions
🇬🇧 English🇫🇷 Français🇩🇪 Deutsch🇪🇸 Español🇮🇹 Italiano

Real estate price map


Real estate price map in the municipality of Vanves, choose a section to see transactions by parcel.

Hauts-de-Seine (92)

Vanves - Real estate price m²

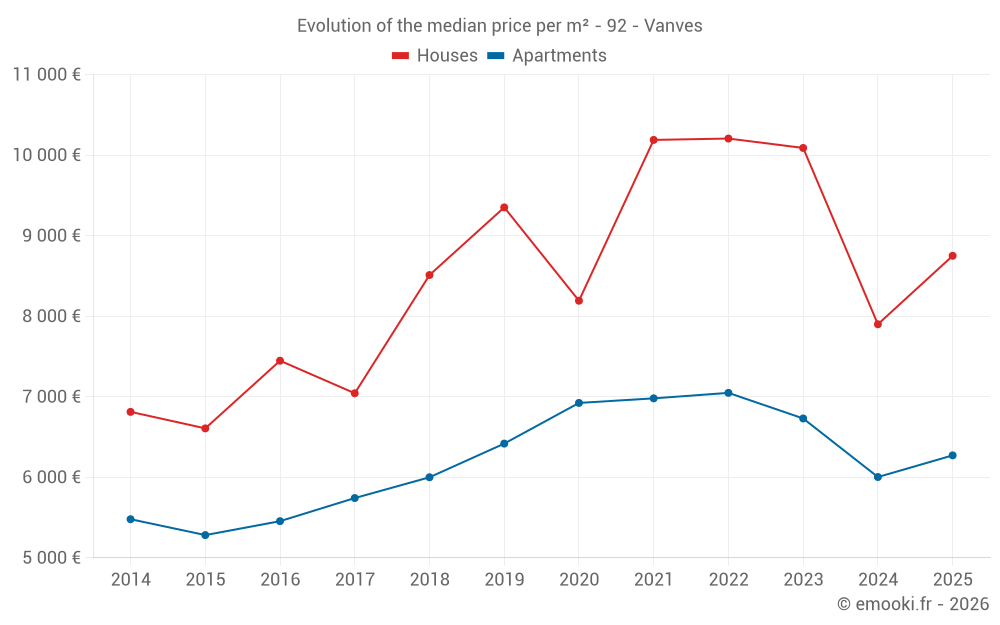
Median price of real estate
in the municipality of Vanves

HousesHouses
8 256  /m²
1-23-45-67-89-10
Reliability 8/10
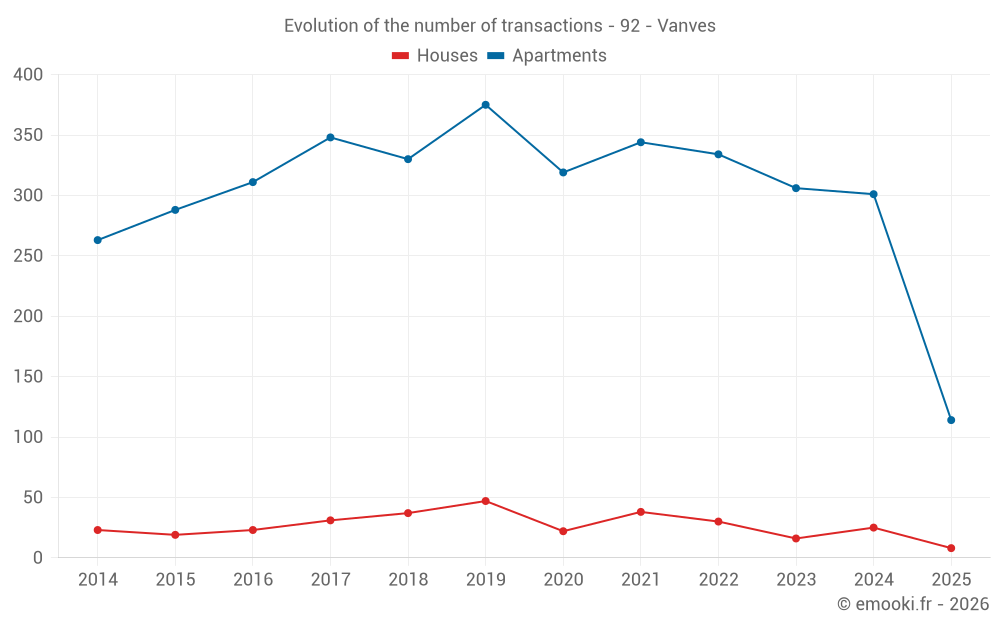
Median price on the 22 transactions of the last 12 months.
from 6 577 to
10 775  /m²
60% of transactions from the 2nd to the 8th deciles.
ApartmentsApartments
6 053  /m²
1-23-45-67-89-10
Reliability 10/10
Median price on the 34 transactions of the last 3 months.
from 4 788 to
6 954  /m²
60% of transactions from the 2nd to the 8th deciles.
DwellingsDwellings
6 148  /m²
1-23-45-67-89-10
Reliability 10/10
Median price on the 35 transactions of the last 3 months.
from 4 812 to
6 966  /m²
60% of transactions from the 2nd to the 8th deciles.
HousesEvolution of the price per m² of houses since...
1 year
+11%
2 years
-13%
3 years
-14%
4 years
-14%
5 years
+6.8%
6 years
-6.4%
7 years
+2.8%
8 years
+24%
9 years
+17%
10 years
+32%
11 years
+28%
The price per m² of houses has decreased by 14% since 3 years, but it has increased by 32% in 10 years.
ApartmentsEvolution of the price per m² of apartments since...
1 year
+4.5%
2 years
-6.8%
3 years
-11%
4 years
-10%
5 years
-9.4%
6 years
-2.3%
7 years
+4.5%
8 years
+9.2%
9 years
+15%
10 years
+19%
11 years
+14%
The price per m² of apartments has decreased by 11% since 3 years, but it has increased by 19% in 10 years.

Yearly evolution

Evolution of the median price per m²

Evolution of the median price per m² - 92 - Vanves

Evolution of the number of transactions

Warning, last year incomplete. Projections made based on the proportions between semesters of the previous year at the departmental/national level and by type of property.

Evolution of the number of transactions - 92 - Vanves

Yearly data

Descending order
Year
Houses
house
transactions
Houses
house
Price per m²
Apartments
apt.
transactions
Apartments
apt.
Price per m²
2025
8
8 750 
114
6 272 
2024
25
7 900 
301
6 003 
2023
16
10 089 
306
6 730 
2022
30
10 206 
334
7 048 
2021
38
10 189 
344
6 980 
2020
22
8 192 
319
6 923 
2019
47
9 351 
375
6 418 
2018
37
8 511 
330
6 000 
2017
31
7 043 
348
5 742 
2016
23
7 447 
311
5 455 
2015
19
6 607 
288
5 282 
2014
23
6 812 
263
5 479 

Analysis

Structure of prices per m²

Values of price percentiles per m² over the periods used for the estimated price of each type of property.

Structure of transaction amounts

Values of transaction amounts percentiles over the periods used for the estimated price of each type of property.

Transaction amounts and prices per m² by percentile

Ascending order
Percentile
Houses
house
Price per m²
Houses
house
Transaction amount
Apartments
apt.
Price per m²
Apartments
apt.
Transaction amount
10th percentile
5 448 
414 K
4 355 
145 K
20th percentile
6 577 
693 K
4 788 
155 K
30th percentile
7 481 
746 K
5 166 
160 K
40th percentile
7 984 
774 K
5 390 
175 K
50th percentile
8 256 
863 K
6 053 
188 K
60th percentile
8 864 
998 K
6 450 
235 K
70th percentile
9 727 
1 004 K
6 703 
260 K
80th percentile
10 775 
1 064 K
6 954 
290 K
90th percentile
13 478 
1 202 K
7 080 
405 K

National and departmental comparison

Evolution of the median price per m² of houses

Evolution of the median price per m² of apartments

Quarterly evolution

Evolution of the median price per m²

Evolution of the number of transactions

Quarterly data

Descending order
Quarter
Houses
house
transactions
Houses
house
Price per m²
Apartments
apt.
transactions
Apartments
apt.
Price per m²
2025 Q2
1
9 044 
34
6 053 
2025 Q1
7
8 455 
80
6 308 
2024 Q4
5
6 667 
75
5 823 
2024 Q3
9
8 595 
92
6 192 
2024 Q2
8
7 714 
76
5 905 
2024 Q1
3
7 584 
58
6 486 
2023 Q4
3
6 400 
65
6 371 
2023 Q3
5
8 697 
78
6 706 
2023 Q2
3
10 508 
87
6 767 
2023 Q1
5
11 492 
76
7 124 
2022 Q4
7
10 400 
76
6 960 
2022 Q3
7
9 758 
85
6 924 
2022 Q2
11
10 702 
101
7 407 
2022 Q1
5
8 989 
72
7 012 
2021 Q4
8
10 962 
71
7 178 
2021 Q3
9
8 536 
102
6 878 
2021 Q2
17
9 664 
95
7 125 
2021 Q1
4
9 916 
76
6 978 
2020 Q4
9
9 685 
103
7 222 
2020 Q3
4
9 412 
69
6 938 
2020 Q2
4
6 817 
67
6 736 
2020 Q1
5
8 000 
80
6 680 
2019 Q4
18
11 808 
92
6 712 
2019 Q3
7
8 988 
103
6 471 
2019 Q2
13
9 351 
94
6 667 
2019 Q1
9
8 909 
86
6 094 
2018 Q4
10
8 936 
86
6 108 
2018 Q3
14
8 892 
92
6 109 
2018 Q2
8
9 830 
83
6 000 
2018 Q1
5
7 103 
69
5 652 
2017 Q4
7
8 377 
68
5 686 
2017 Q3
8
6 926 
102
6 046 
2017 Q2
10
7 818 
82
5 620 
2017 Q1
6
6 084 
96
5 631 
2016 Q4
5
6 579 
69
5 407 
2016 Q3
6
7 687 
97
5 686 
2016 Q2
5
7 447 
76
5 284 
2016 Q1
7
8 088 
69
5 462 
2015 Q4
7
6 688 
71
5 149 
2015 Q3
7
5 351 
91
5 424 
2015 Q2
3
8 029 
64
5 278 
2015 Q1
2
12 254 
62
5 290 
2014 Q4
9
7 000 
56
5 508 
2014 Q3
4
7 398 
69
5 552 
2014 Q2
4
5 244 
67
5 250 
2014 Q1
6
7 080 
71
5 556 

Overview of the latest real estate transactions

The following list is an anonymized overview of the latest transactions. For more details and to find all transactions, please use the map to view transactions by plot or the transaction search page for a search by criteria.

2025-06-30
180 000 
5 294  /m²(34 m²)
Sale
Apartments
Apartment
1 room
34 m2
1 outbuilding
2025-06-26
157 250 
5 824  /m²(27 m²)
Sale
Apartments
Apartment
2 rooms
27 m2
2025-06-25
18 823 578 
Sale
Land
464 m2
-Terrains à bâtir
Land
220 m2
-Terrains à bâtir
Land
87 m2
-Terrains à bâtir
Land
229 m2
-Terrains à bâtir
Land
254 m2
-Terrains à bâtir
Land
412 m2
-Terrains à bâtir
Land
37 m2
-Terrains à bâtir
Land
31 m2
-Terrains à bâtir
Land
28 m2
-Terrains à bâtir
2025-06-24
140 000 
3 784  /m²(37 m²)
Sale
Apartments
Apartment
2 rooms
37 m2
2025-06-23
146 000 
6 952  /m²(21 m²)
Sale
Apartments
Apartment
1 room
21 m2
2025-06-23
15 000 
Sale
1 outbuilding
2025-06-23
168 000 
7 000  /m²(24 m²)
Sale
Apartments
Apartment
1 room
24 m2
2025-06-23
442 000 
5 740  /m²(77 m²)
Sale
Apartments
Apartment
5 rooms
77 m2
1 outbuilding
2025-06-23
286 000 
5 958  /m²(48 m²)
Sale
Apartments
Apartment
3 rooms
48 m2
2025-06-20
259 000 
4 317  /m²(60 m²)
Sale
Apartments
Apartment
3 rooms
60 m2
1 outbuilding
2025-06-20
157 000 
6 542  /m²(24 m²)
Sale
Apartments
Apartment
1 room
24 m2
2025-06-20
155 000 
7 045  /m²(22 m²)
Sale
Apartments
Apartment
1 room
22 m2
2025-06-19
14 000 
Exchange
2 outbuildings
2025-06-18
84 993 
5 666  /m²(15 m²)
Sale
Commercial property
15 m2
2025-06-18
155 100 
6 463  /m²(24 m²)
Sale
Apartments
Apartment
1 room
24 m2
2025-06-11
200 000 
8 000  /m²(25 m²)
Sale
Commercial property
25 m2
2025-06-11
268 800 
4 716  /m²(57 m²)
Sale
Apartments
Apartment
3 rooms
57 m2
1 outbuilding
2025-06-10
281 225 
6 696  /m²(42 m²)
Sale
Apartments
Apartment
2 rooms
42 m2
1 outbuilding
1 outbuilding
2025-06-06
142 000 
4 176  /m²(34 m²)
Sale
Apartments
Apartment
2 rooms
34 m2
1 outbuilding
2025-06-06
318 000 
5 300  /m²(60 m²)
Sale
Apartments
Apartment
3 rooms
60 m2
1 outbuilding
6041 transactions listed in the municipality

Hauts-de-Seine (92)

Most expensive cities

City
name
Descending orderHouses
house
Price per m²
16 016 
11 628 
9 715 
9 566 
9 231 
9 146 
8 847 
City
name
Descending orderApartments
apt.
Price per m²
10 322 
8 698 
7 427 
7 273 
6 798 
6 620 
6 509 

Least expensive cities

City
name
Ascending orderHouses
house
Price per m²
5 862 
6 219 
6 630 
6 632 
6 656 
6 662 
City
name
Ascending orderApartments
apt.
Price per m²
4 418 
4 434 
4 724 
4 773 
4 839 
4 868 
4 941 
5 058