emooki
HomePrice mapTransactions
🇬🇧 English🇫🇷 Français🇩🇪 Deutsch🇪🇸 Español🇮🇹 Italiano

Real estate price map


Real estate price map in the municipality of Châtillon.

Hauts-de-Seine (92)
Châtillon

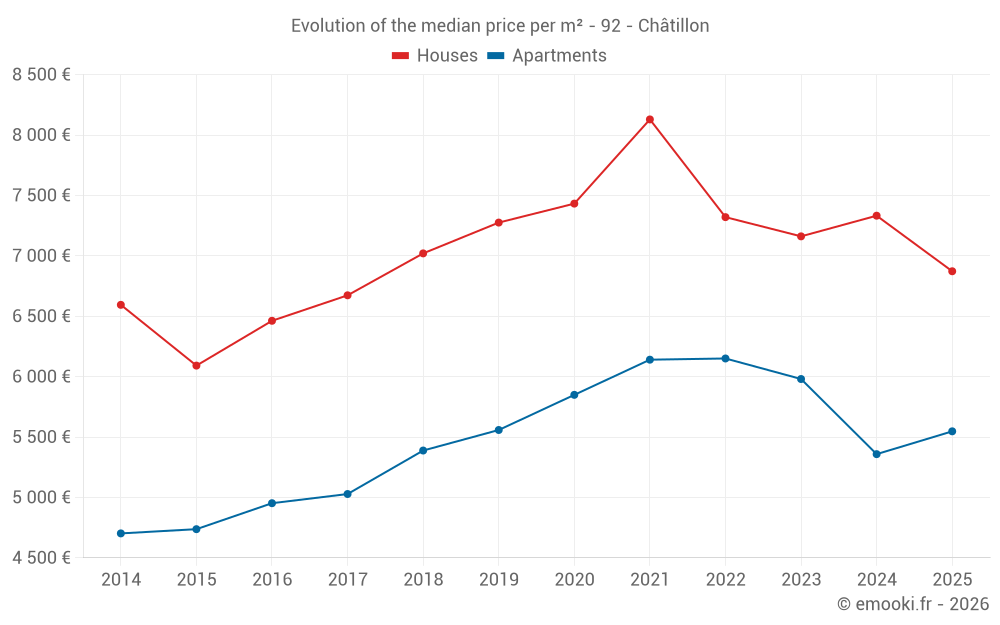
Median price of real estate
in the municipality of Châtillon

HousesHouses
6 872  /m²
1-23-45-67-89-10
Reliability 9/10
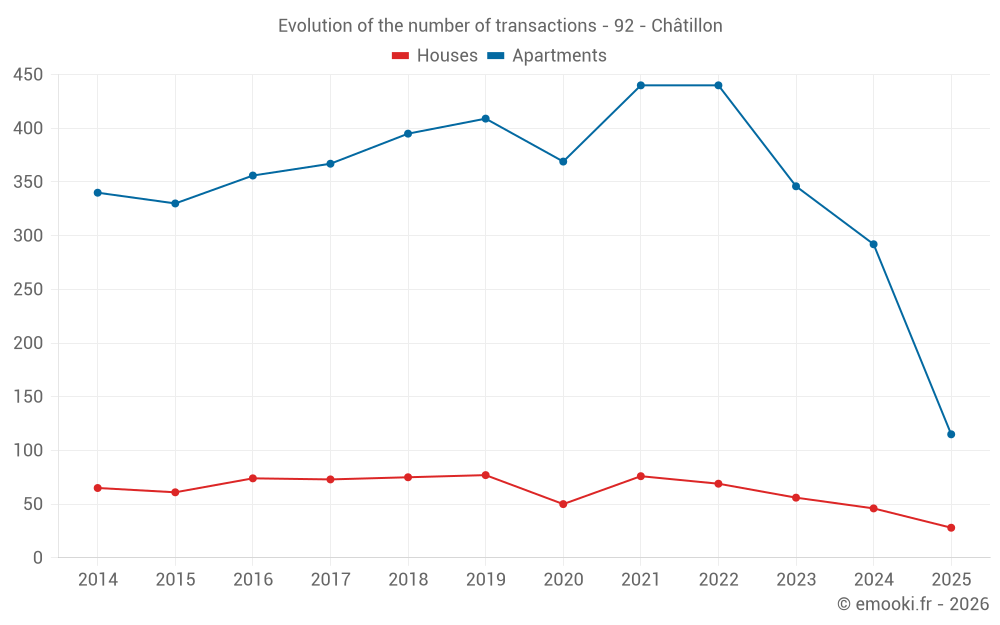
Median price on the 28 transactions of the last 6 months.
from 5 857 to
7 832  /m²
60% of transactions from the 2nd to the 8th deciles.
ApartmentsApartments
5 816  /m²
1-23-45-67-89-10
Reliability 10/10
Median price on the 34 transactions of the last 3 months.
from 4 335 to
7 001  /m²
60% of transactions from the 2nd to the 8th deciles.
DwellingsDwellings
6 026  /m²
1-23-45-67-89-10
Reliability 10/10
Median price on the 46 transactions of the last 3 months.
from 4 394 to
7 229  /m²
60% of transactions from the 2nd to the 8th deciles.
HousesEvolution of the price per m² of houses since...
1 year
-6.3%
2 years
-4%
3 years
-6.1%
4 years
-15%
5 years
-7.5%
6 years
-5.5%
7 years
-2.1%
8 years
+3%
9 years
+6.3%
10 years
+13%
11 years
+4.2%
ApartmentsEvolution of the price per m² of apartments since...
1 year
+3.5%
2 years
-7.2%
3 years
-10%
4 years
-10%
5 years
-5.2%
6 years
-0.2%
7 years
+3%
8 years
+10%
9 years
+12%
10 years
+17%
11 years
+18%

Yearly evolution

Evolution of the median price per m²

Evolution of the number of transactions

Warning, last year incomplete. Projections made based on the proportions between semesters of the previous year at the departmental/national level and by type of property.

Yearly data

Descending order
Year
Houses
house
transactions
Houses
house
Price per m²
Apartments
apt.
transactions
Apartments
apt.
Price per m²
2025
28
6 872 
115
5 547 
2024
46
7 332 
292
5 358 
2023
56
7 161 
346
5 980 
2022
69
7 320 
440
6 150 
2021
76
8 129 
440
6 140 
2020
50
7 432 
369
5 849 
2019
77
7 275 
409
5 558 
2018
75
7 020 
395
5 388 
2017
73
6 673 
367
5 028 
2016
74
6 462 
356
4 952 
2015
61
6 091 
330
4 737 
2014
65
6 594 
340
4 702 

Analysis

Structure of prices per m²

Values of price percentiles per m² over the periods used for the estimated price of each type of property.

Structure of transaction amounts

Values of transaction amounts percentiles over the periods used for the estimated price of each type of property.

Transaction amounts and prices per m² by percentile

Ascending order
Percentile
Houses
house
Price per m²
Houses
house
Transaction amount
Apartments
apt.
Price per m²
Apartments
apt.
Transaction amount
10th percentile
5 677 
398 K
3 751 
163 K
20th percentile
5 857 
452 K
4 335 
205 K
30th percentile
6 206 
530 K
4 540 
249 K
40th percentile
6 598 
595 K
5 474 
264 K
50th percentile
6 872 
644 K
5 816 
286 K
60th percentile
7 315 
706 K
6 350 
314 K
70th percentile
7 552 
775 K
6 675 
337 K
80th percentile
7 832 
825 K
7 001 
375 K
90th percentile
8 801 
949 K
7 246 
532 K

National and departmental comparison

Evolution of the median price per m² of houses

Evolution of the median price per m² of apartments

Quarterly evolution

Evolution of the median price per m²

Evolution of the number of transactions

Quarterly data

Descending order
Quarter
Houses
house
transactions
Houses
house
Price per m²
Apartments
apt.
transactions
Apartments
apt.
Price per m²
2025 Q2
12
6 544 
34
5 816 
2025 Q1
16
6 924 
81
5 500 
2024 Q4
8
6 248 
54
5 258 
2024 Q3
14
7 500 
83
5 438 
2024 Q2
16
7 126 
75
5 308 
2024 Q1
8
8 334 
80
5 370 
2023 Q4
7
6 310 
74
5 690 
2023 Q3
20
7 584 
86
5 864 
2023 Q2
16
7 432 
93
6 233 
2023 Q1
13
7 065 
93
6 231 
2022 Q4
24
7 061 
92
6 098 
2022 Q3
18
7 806 
126
6 110 
2022 Q2
16
7 162 
108
5 966 
2022 Q1
11
7 650 
114
6 344 
2021 Q4
20
8 333 
104
6 138 
2021 Q3
24
7 881 
133
6 267 
2021 Q2
18
7 858 
122
5 947 
2021 Q1
14
7 500 
81
6 135 
2020 Q4
12
7 330 
120
6 021 
2020 Q3
13
7 583 
99
5 817 
2020 Q2
11
5 814 
82
5 724 
2020 Q1
14
9 128 
68
5 756 
2019 Q4
23
6 620 
104
5 634 
2019 Q3
19
7 250 
104
5 610 
2019 Q2
22
7 587 
110
5 528 
2019 Q1
13
7 571 
91
5 343 
2018 Q4
21
6 512 
83
5 388 
2018 Q3
29
7 230 
115
5 422 
2018 Q2
15
7 257 
102
5 424 
2018 Q1
10
6 912 
95
5 197 
2017 Q4
12
6 978 
70
5 242 
2017 Q3
30
6 438 
99
5 288 
2017 Q2
13
6 590 
95
4 893 
2017 Q1
18
7 068 
103
4 907 
2016 Q4
12
6 179 
93
5 078 
2016 Q3
28
6 906 
107
4 967 
2016 Q2
22
6 212 
85
4 857 
2016 Q1
12
6 261 
71
4 913 
2015 Q4
13
6 388 
69
4 839 
2015 Q3
25
6 234 
103
4 821 
2015 Q2
12
5 740 
77
4 596 
2015 Q1
11
6 333 
81
4 745 
2014 Q4
10
6 776 
64
4 615 
2014 Q3
24
6 386 
89
5 042 
2014 Q2
14
6 330 
88
4 597 
2014 Q1
17
7 860 
99
4 678 

Hauts-de-Seine (92)

Most expensive cities

City
name
Descending orderHouses
house
Price per m²
16 016 
11 628 
9 715 
9 566 
9 231 
9 146 
8 847 
City
name
Descending orderApartments
apt.
Price per m²
10 322 
8 698 
7 427 
7 273 
6 798 
6 620 
6 509 

Least expensive cities

City
name
Ascending orderHouses
house
Price per m²
5 862 
6 219 
6 630 
6 632 
6 656 
6 662 
City
name
Ascending orderApartments
apt.
Price per m²
4 418 
4 434 
4 724 
4 773 
4 839 
4 868 
4 941 
5 058